The Rossmont Waver’s web interface
Once powered the Waver, connected to its wireless network, and logged in with access credentials, we encountered the following screen:
As you can see it’s an empty screen. At the top right you can see the request to add a new product. Very easy operation.
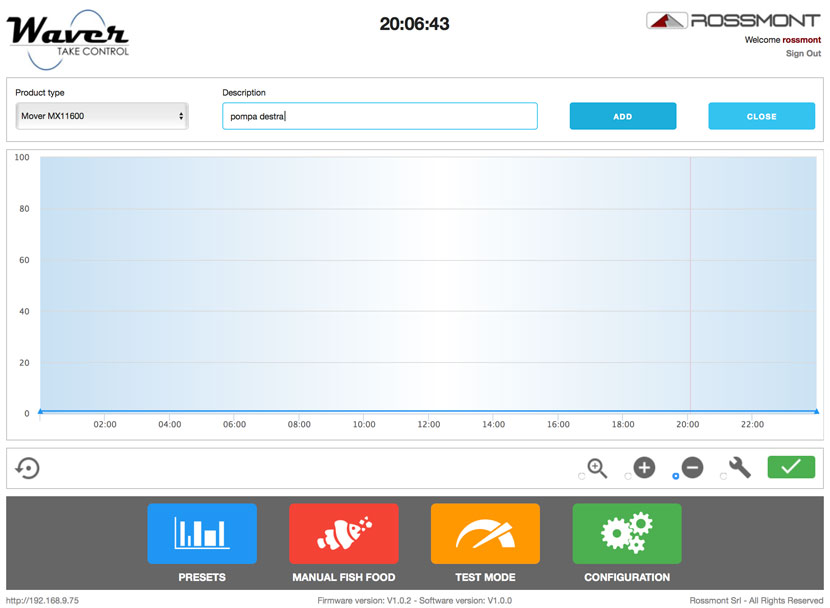
By clicking on the “ADD” button, we get a multiple-choice tab with all the Rossmont pumps models available. You just have to choose your pump and insert a simple description (optional).
As you can see, my choice was quite obvious, and I inserted the right pump.
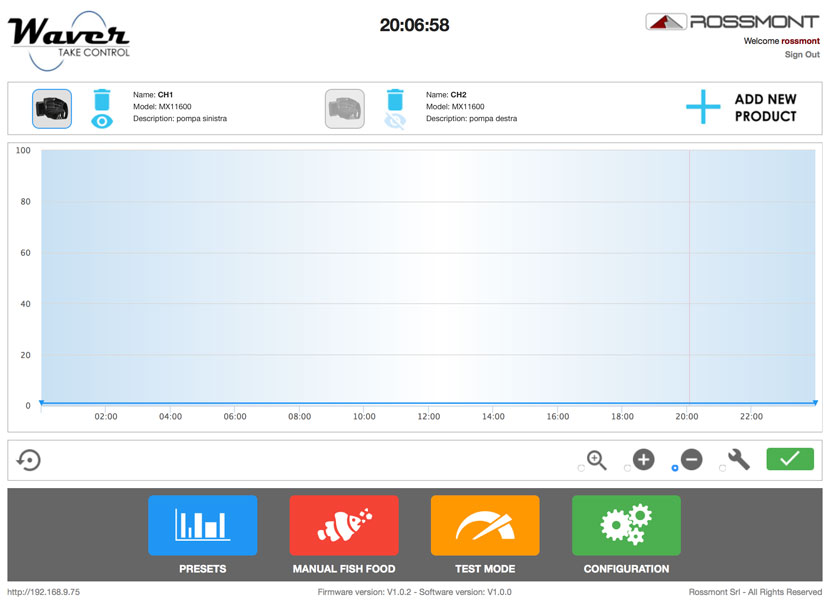
After both choices, you will see a screen like the previous one, where you have to choose the flow power %. You can also see both pump flows on the graph simply by clicking on the eye icon.
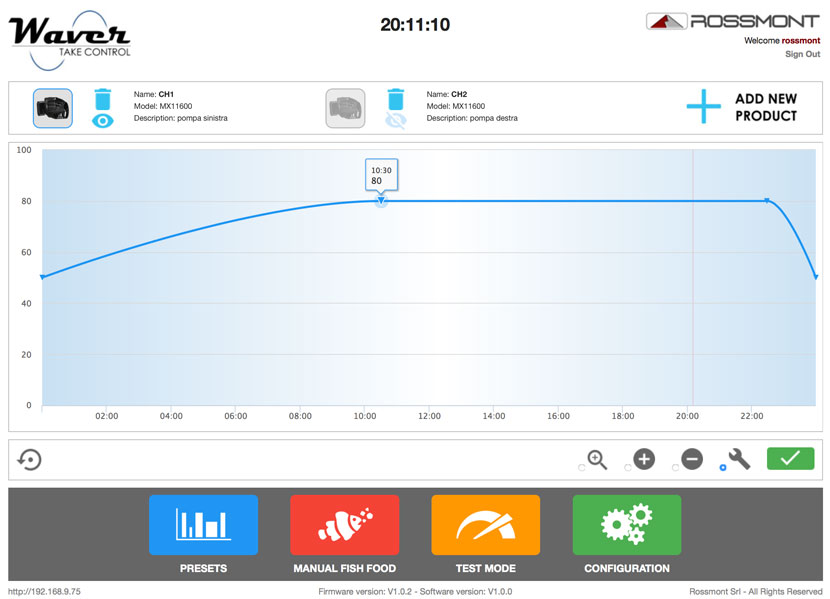
At this point we entered a first point at 50% of the flow and a second point at 50% too. By the “+” button, we added two middle points at 80%. The program takes care of creating the curve with the right energy. Then acting with the button with the tool you can drag points anywhere, thus changing time and power, in a very simple way.
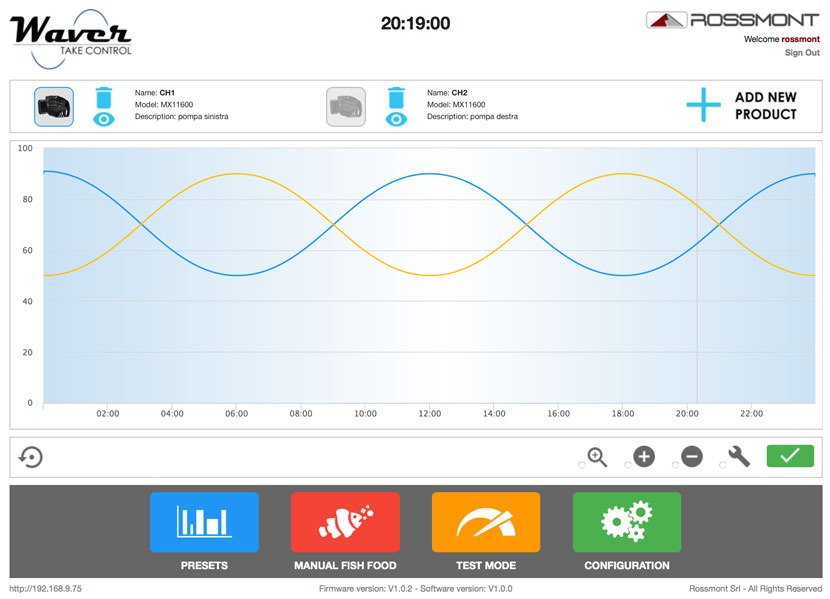
We wanted to simulate the movement of the tides, considering that our two pumps were installed facing each other, so making them work mirrored. We added a point every 6 hours. One at 90% and one at 50%. The result is as follows.
Obviously, you can do and edit the same thing with smartphones and tablets. It’s very easy and intuitive.
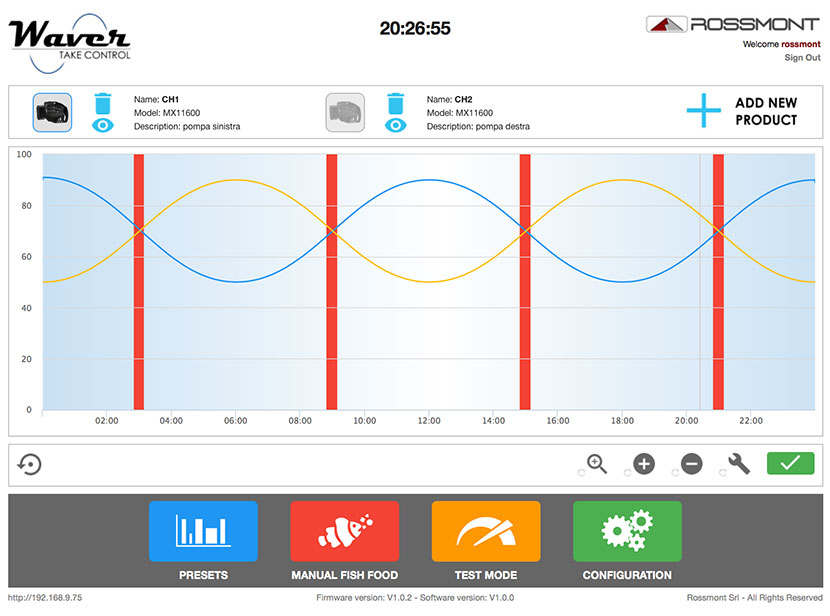
As you can see from the graph we have created a mirrored sinusoidal curve. One is the pump on the right and the other is the one on the left. The red vertical line is the actual time while we are logged in.
The 4 coloured buttons
But of course there’s much more. There are 4 large coloured buttons:
- Manual Fish Food: it slows down the pump(s) at minimum % for the feed operation ( this function can also be done by Waver’s touch button or by a preset application)
- Test Mode: the full schedule is played in 5 min to check what we have done
- Configuration: the options screen with Waver’s instruction manual, the possibility to reset all the settings to factory default, network settings, etc..
- Preset: the advanced settings of the controller
The advanced settings (preset)
By acting on the Preset button, it appears a screen that allows us to choose an effect among six proposals.
As you can see you can choose the 6 following effects:
- Fixed: pumps at fixed flowrate (orange button)
- Fish Food: pumps at minimum power (pink button)
- Off: this turns off pumps (purple button)
- Cycle: alternations from minimum to maximum power, for waves simulation (green button)
- Random: casual transitions from minimum to maximum (yellow button)
- Stormy: casual but very fast transitions to simulate a storm (blue button)
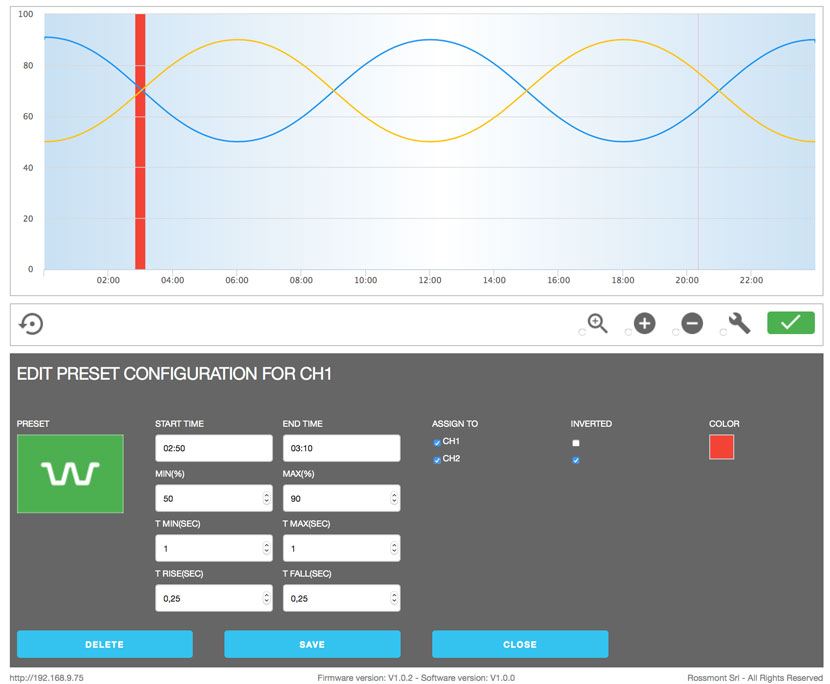
I started with an alternate cycle where my two flows cross.
In this way for 20min the flow goes from a minimum of 50% to a maximum of 90%, always in opposition (you see the tick on CH2 “inverted”), with 1 second stable at minimum and 1 at maximum power, and a time ramp of 0,25 seconds.
I repeated the effect at every intersection and what you see is the final graph.
 Once closed the Preset window, the final graph becomes cleaner.
My settings is currently this one, even if I periodically insert or delete some effects and I change the power of the pumps based on the aquarium trend.


