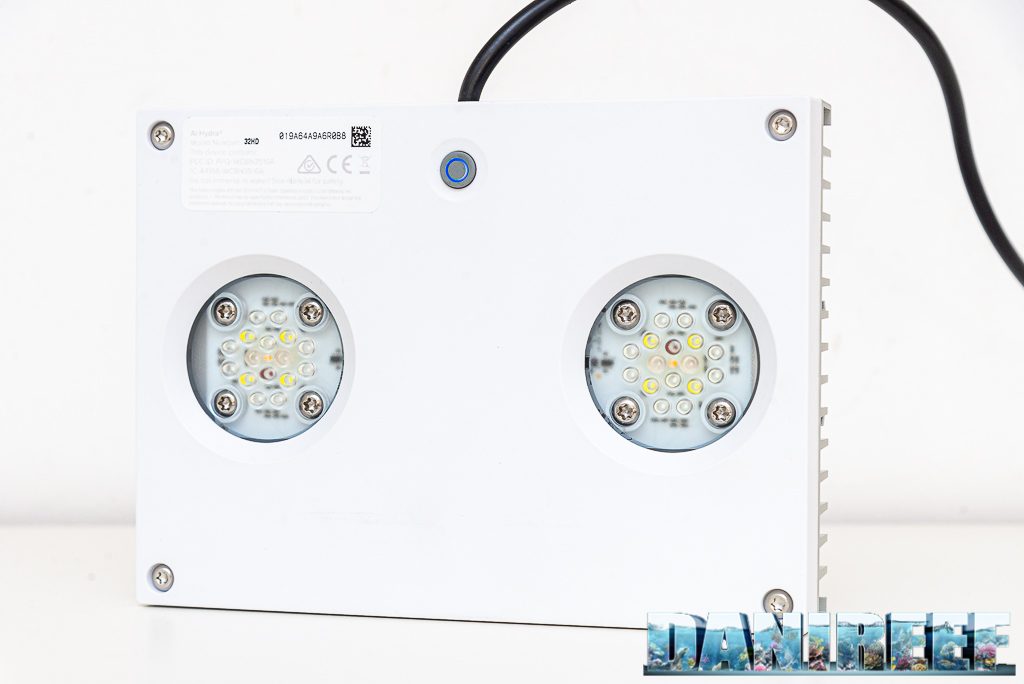
Our new method DaniReef LAB for PAR measurement of the AquaIllumination Hydra 32 HD
Backstory: (this paragraph is the same for all the ceiling lights tested with our DaniReef method in order to explain the working method) During the long nights spent on our forum (here) we always wondered how could we compare PAR from different ceiling lights. Even though we had the perfect device, the Quantum Meter MQ-510 di Apogee, we always referred only to the value measured at the centre at 20 cm of distance, more or less.
The Quantum Meter MQ-510 measures the PAR, expressed in PFFD that is photosynthetic photon flux density in μmol m-2 s-1. This device is calibrated to work underwater, so if it’s in air the measured value has to be divided by 1,32 that’s the dive factor. We have to do the conversion. The values you’re going to see are correct.

We decided to make a square base of 70×70 cm, we set 17 fiducial points where we placed the sensor Quantum Meter MQ-510 and we also made 3 lifts of 20, 40 and 60 cm for the ceiling light, in order to have the same distance from the sensor. This will allow us to create the curves which can be compared to other ceiling lights’s, all tested at the same distances. Notice that this distance is measured between the base of the sensor and the ceiling light. In reality it should be decreased of 3,5 cm that is the height of the measurement cylinder and increased by 0,5 cm that’s the dimension of the spacers that lift the ceiling light.
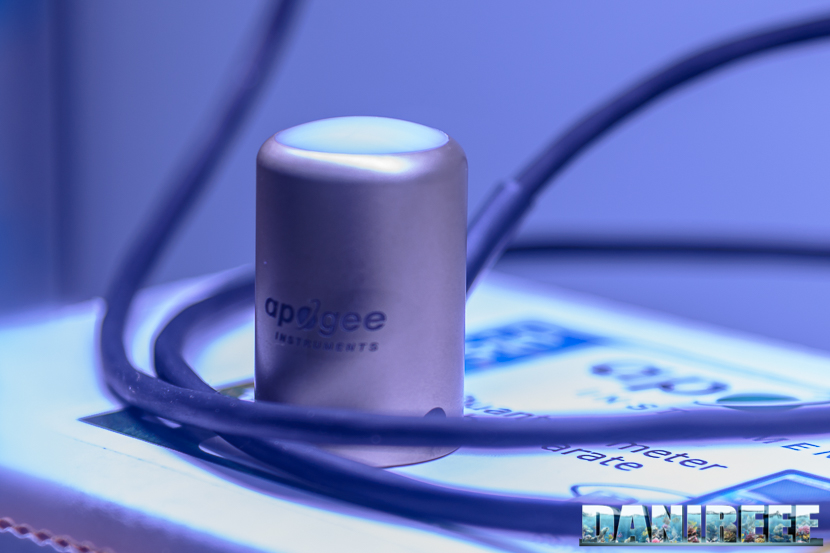
In total the three measurements are made from 17, 37 and 57 cm of distance. Because they’ve been done in air they will be corrected.
PAR measurement from 17 cm of distance
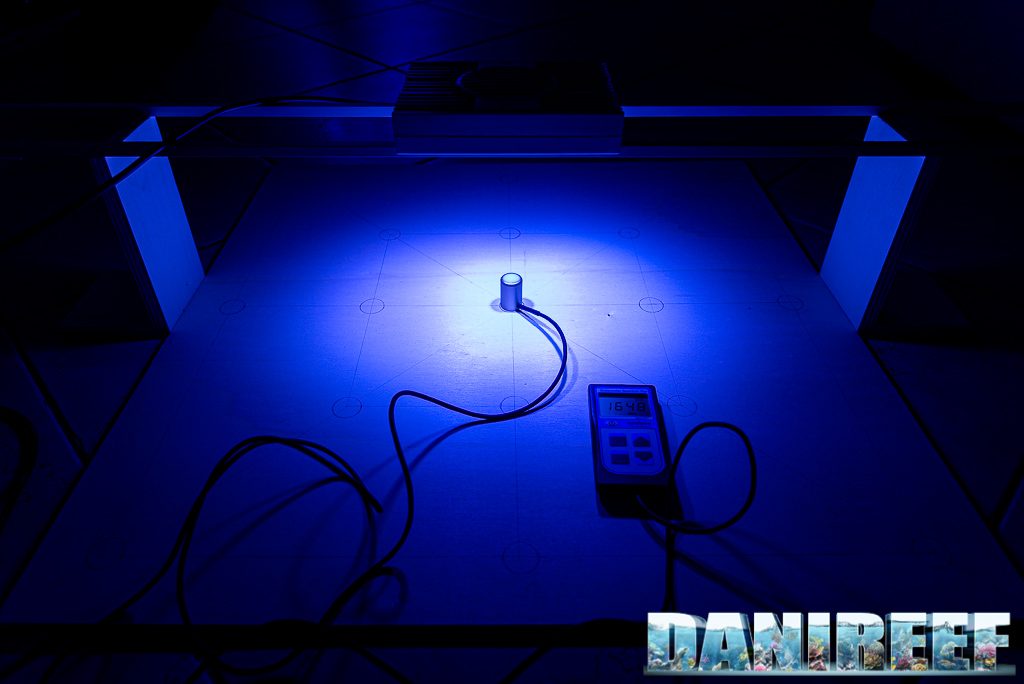
This is the condition of the test. Below there are the chart and the device, above the ceiling light placed on the aluminum bars.
Here the collected values:
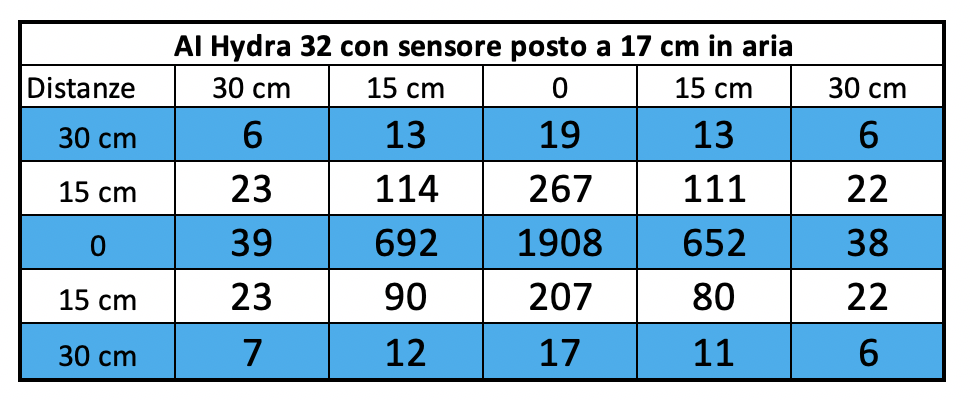
And that’s the corresponding chart, we came back to our classical scale in order to compare similar ceiling lights.
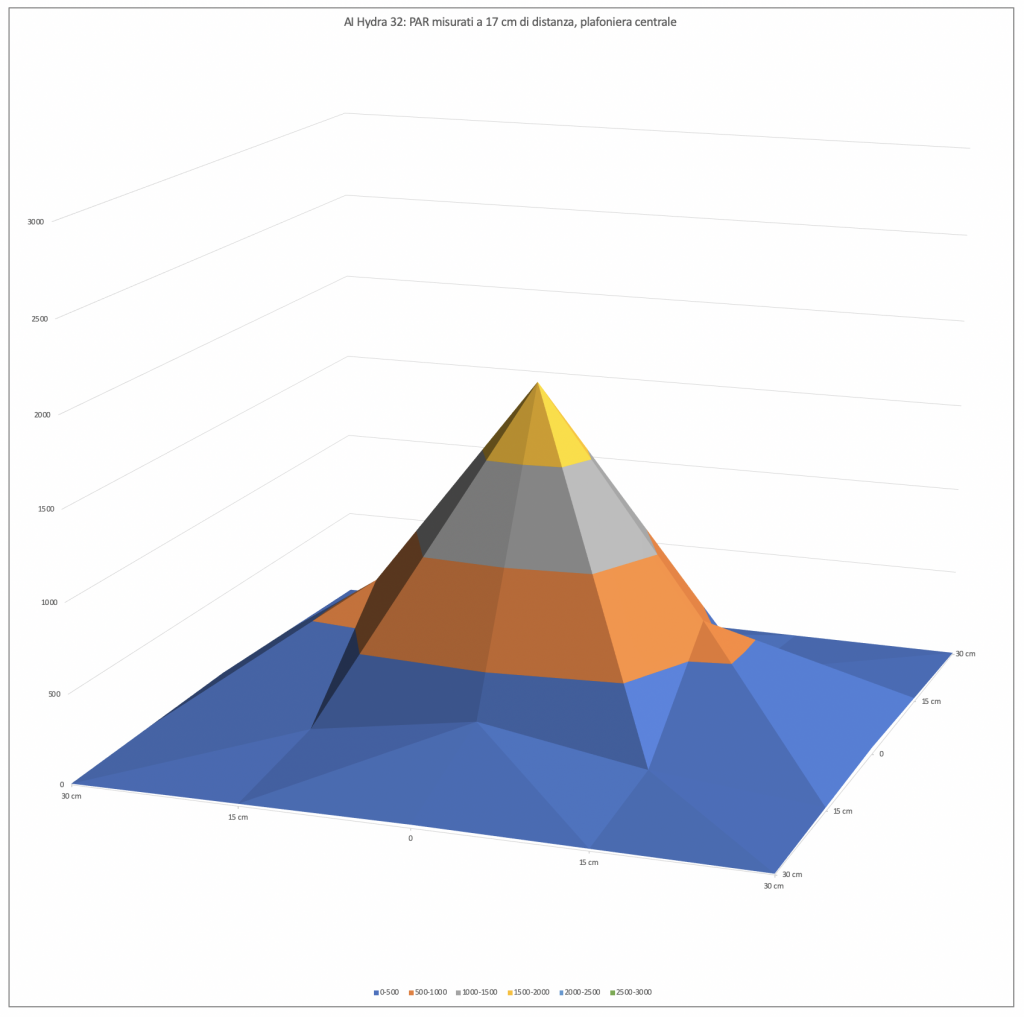
The first measurement has the shorter distance between sensor and ceiling light. But you can see how the light distribution is pretty concentrate. Consider that we have a base of 60×60 which is a definitely a lot for such a small ceiling light. Anyway, it’s obvious that the PAR quickly decrease on all the sides.
PAR measurement from 37 cm of distance
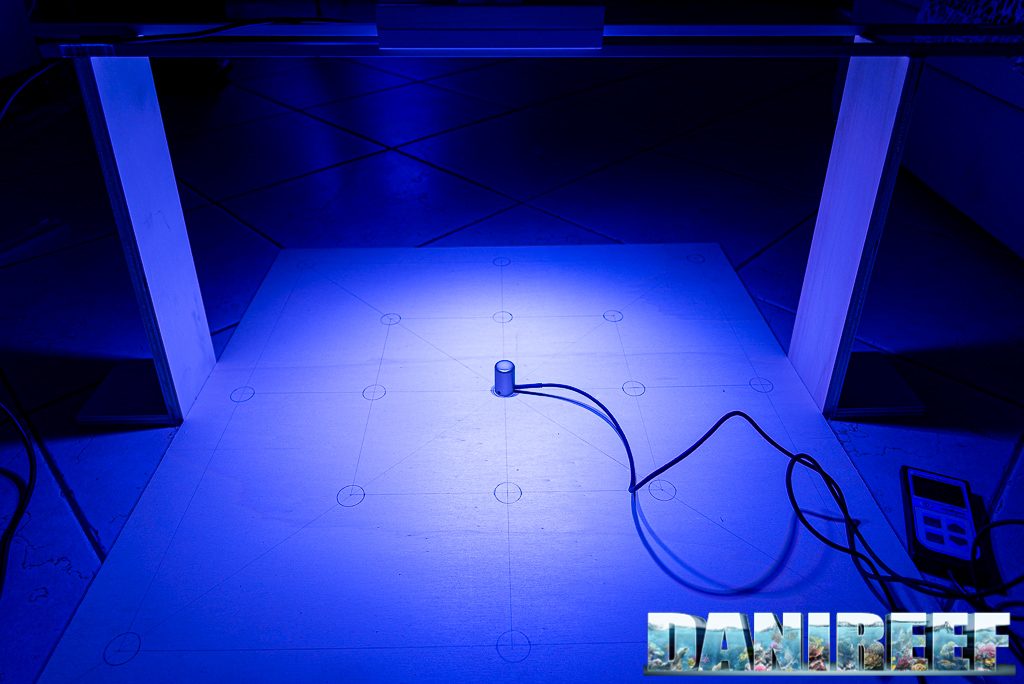
This is the condition of the test. Below there are the chart and the device, above the ceiling light placed on the aluminum bars.
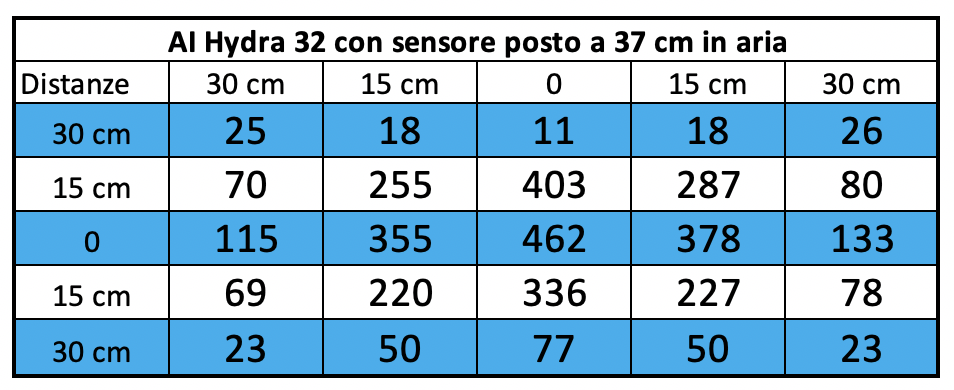
Here the collected values:
And that’s the corresponding chart.
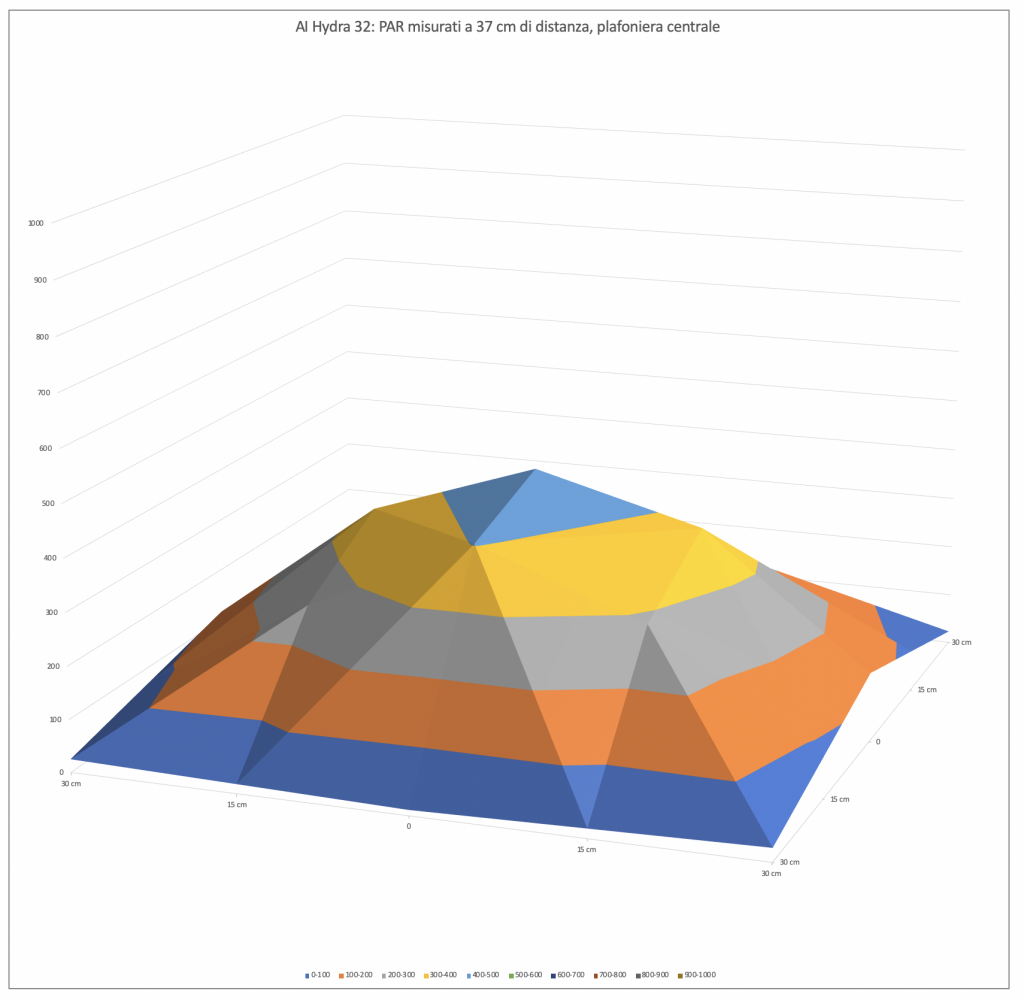
With a bigger space between ceiling lights and sensor, it decreases the difference between PAR in the middle and on the sides. The light spreads, the difference between the middle and the sides is of a distributed light lamp, and the central value decreases from 1908 to 462 μmol m-2 s-1.
PAR measurement from 57 cm of distance
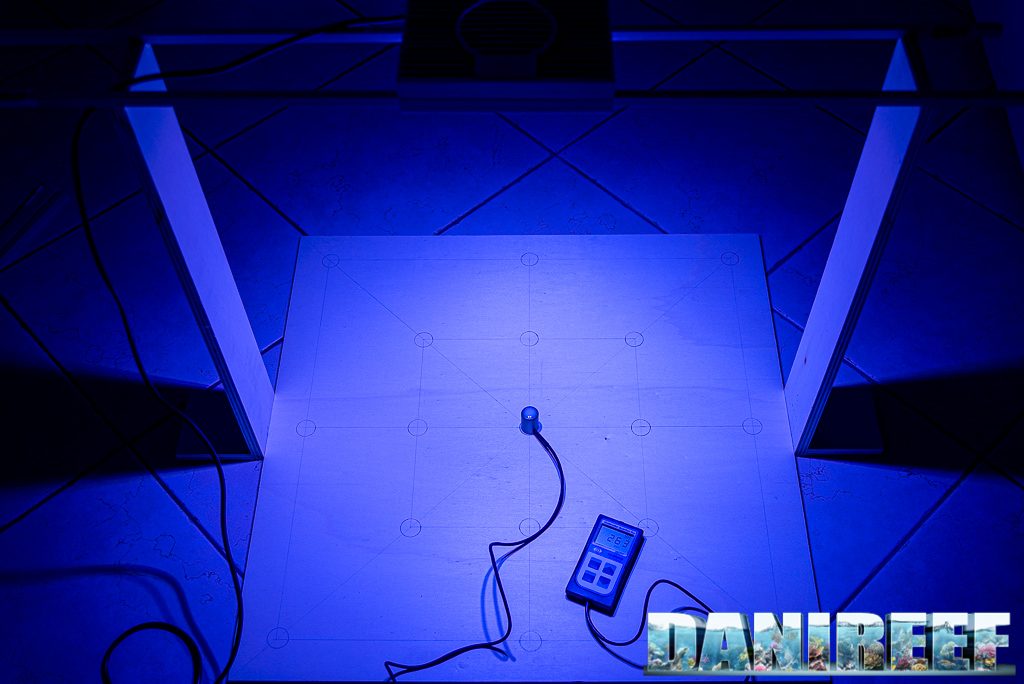
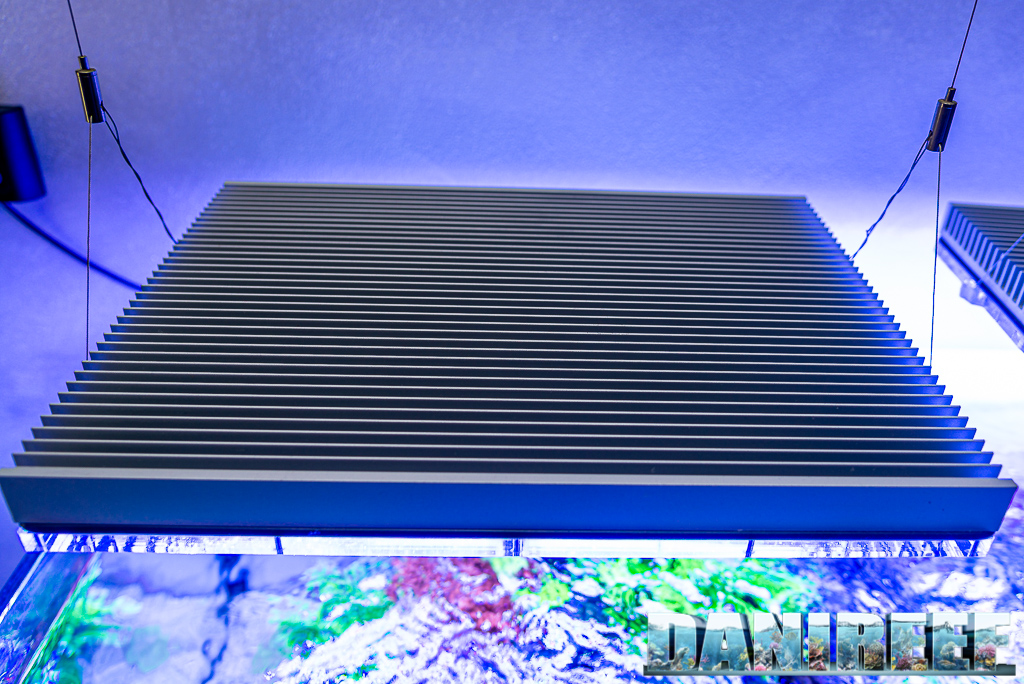
This is the condition of the test. Below there’s the chart, from this distance the device is very visible, and the ceiling light placed on the aluminum bars. Even visually the illuminated area is wider, so the specific power per cm decreases.
Here the collected values:
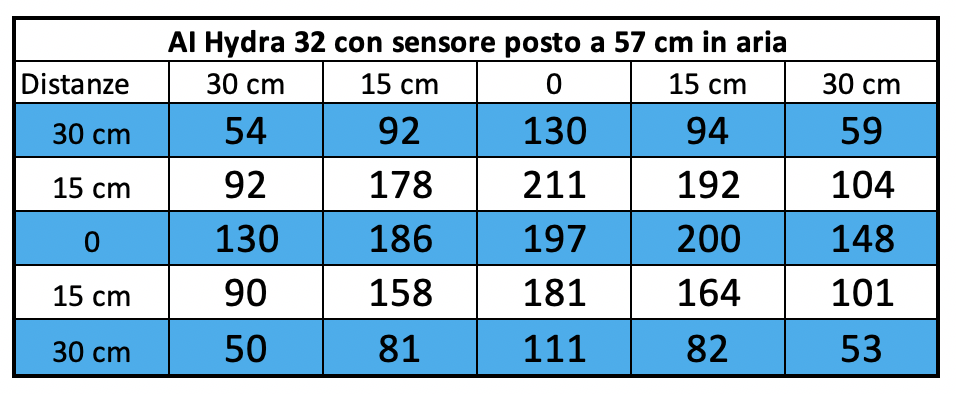
And that’s the corresponding chart.
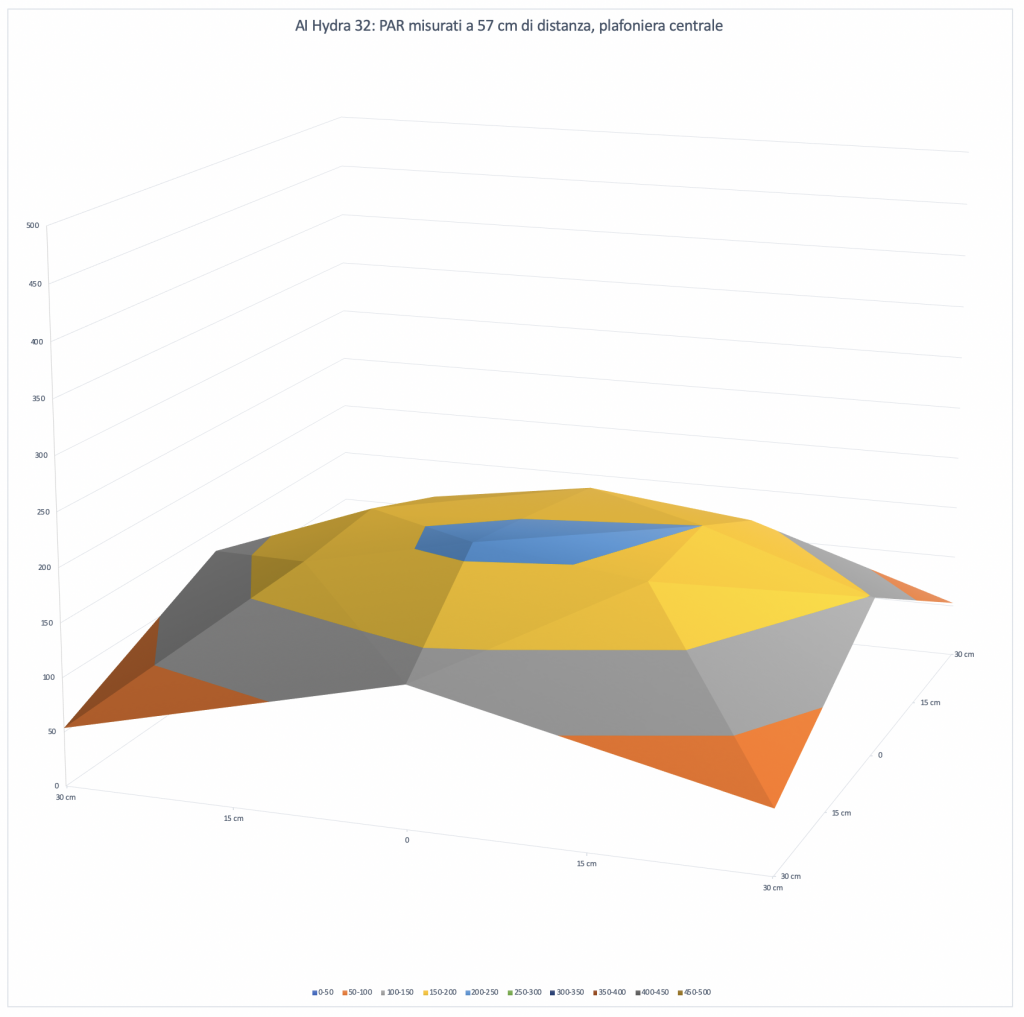
Increasing even more the space between ceiling light and sensor, it decreases even more the difference between PAR in the middle and on the sides. We have more uniformity, as expected, but the final power decreases a lot. The light spreads, while the central value decreases from 1908 to 462 to 197 μmol m-2 s-1.
It sticks out that the coverage is uniform.
The PAR in the middle in the different configurations
Let’s continue with our technical measurements. We can see how, in a chart, the PAR collected in the middle decrease in the three different distances of the tests.
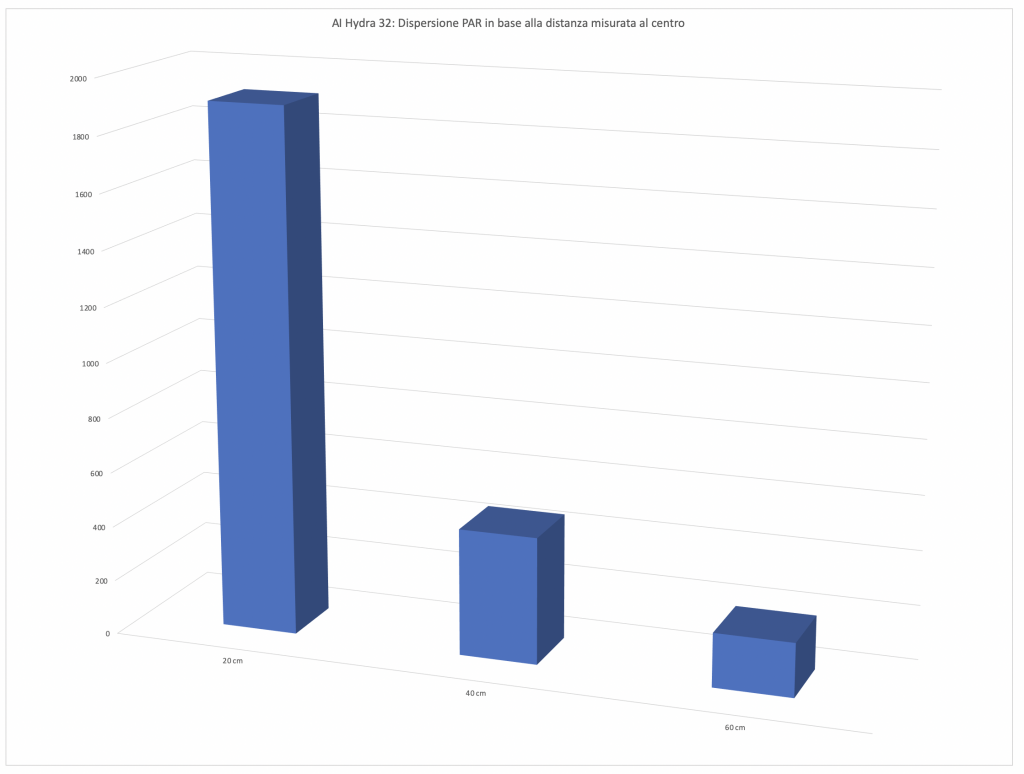
Energy variation of the AI Hydra 32 HD depending on the distances
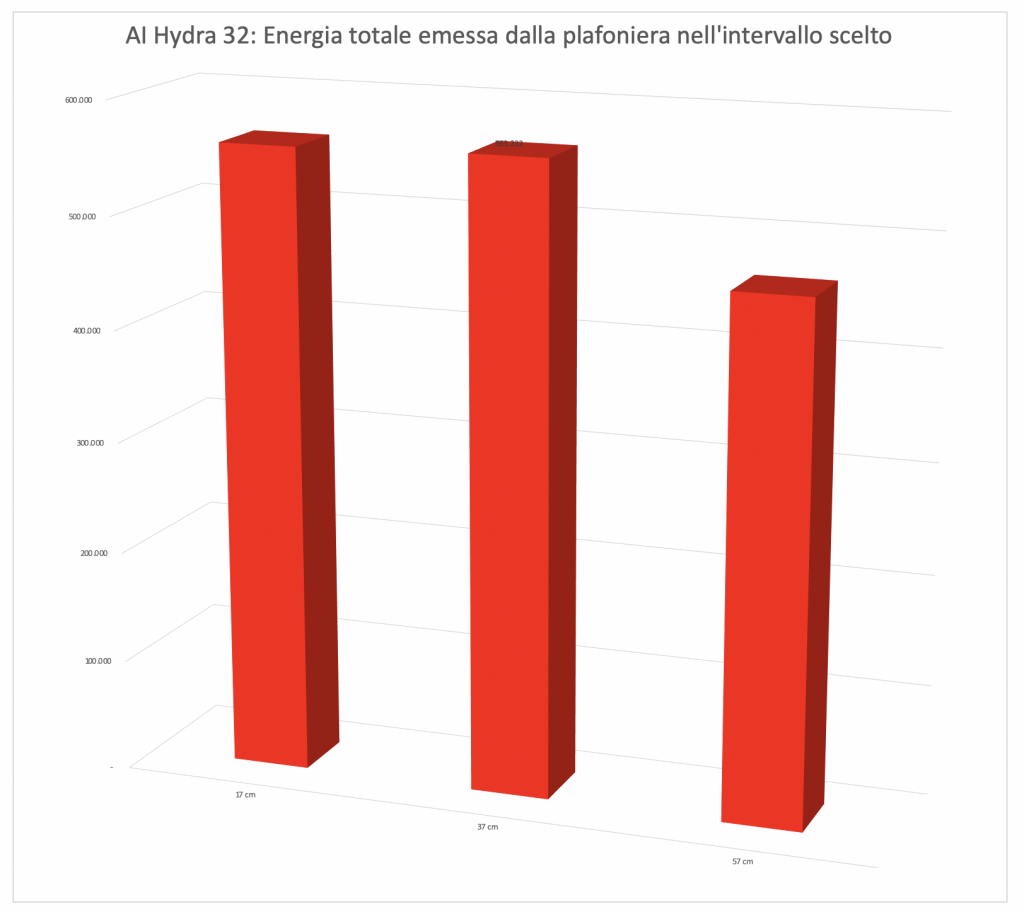
This is the most significant and most comparable data. The energy variation. We calculated the volumes of the three surfaces previously seen. It’s obvious that moving away from the ceiling light the PAR decrease, also because the light illuminates a wider space. In this way you can consider all the light energy contained in the 60×60 cm area subtended by the ceiling light. And the three values 560.185, 563.232 and 462.614 assume a different connotation compared to the values in the middle. When the first ones decrease because of the increasing of the distances, the subtended area, that is the energy, decreases less, because the main part of the lighting is in the middle.
In fact, looking at the values of the three curves you can see that at the sides there’s more light at 37 cm than at 17 cm.
Values per channel in the middle in the three distances
We also measured the values per each channel, but only in the middle, in order to give you an idea of the contribution of different channels on PAR produced.
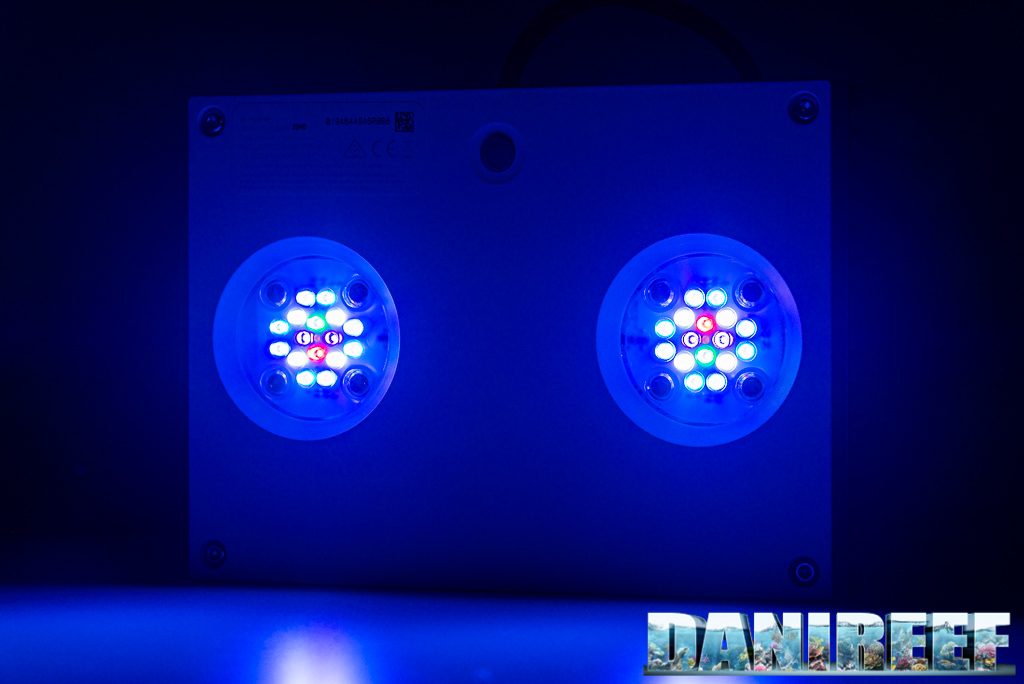
Let’s take a look at the measured values:
| Distance = 17 cm | Distance = 37 cm | Distance = 57 cm | |
| Channel 1 | 97 μmol m-2 s-1 | 30 μmol m-2 s-1 | 13 μmol m-2 s-1 |
| Channel 2 | 92 μmol m-2 s-1 | 31 μmol m-2 s-1 | 14 μmol m-2 s-1 |
| Channel 3 | 595 μmol m-2 s-1 | 144 μmol m-2 s-1 | 61 μmol m-2 s-1 |
| Channel 4 | 473 μmol m-2 s-1 | 110 μmol m-2 s-1 | 48 μmol m-2 s-1 |
| Channel 5 | 53 μmol m-2 s-1 | 11 μmol m-2 s-1 | 5 μmol m-2 s-1 |
| Channel 6 | 110 μmol m-2 s-1 | 24 μmol m-2 s-1 | 11 μmol m-2 s-1 |
| Channel 7 | 11 μmol m-2 s-1 | 3 μmol m-2 s-1 | 2 μmol m-2 s-1 |
| Channel 8 | 518 μmol m-2 s-1 | 120 μmol m-2 s-1 | 52 μmol m-2 s-1 |
There are three channels that are the main responsible of PAR emission of ceiling light. They’re Royal Blue, Blue and Warm White. In total, from 17 cm, they constitue the first 1586 μmol m-2 s-1, and the other 5 only 363 μmol m-2 s-1 . That’s the 81%! So if you decrease green and red you wouldn’t have this great result, it’s very little.
Let’s continue on page three with costs, comparison with other ceiling lights and our final opinion


