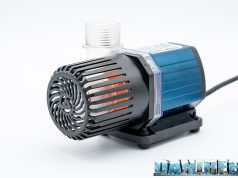
Hydraulic head test
The first test we did concerned the hydraulic head. As you may know the hydraulic head is the pump’s capacity to raise the water over a certain level. In order to do this test we measured the lavel of water reached inside the rubber tube. We didn’t measure every intermediate step as we usually do because in this case we didn’t have them. But we can choose any step without solution of continuity.
As you can see in the picture we fixed a pipe to the balcony. Then, we turned on the pump, we waited about 10 minutes that the pump stabilized and then we did the measurement.
We measured a hydraulic head of 3,64 meters against the declared 3,6 meters.
The gap between the declared data and the one we measured is 1,1%, in favour of the pump. Perfect result.
Flow rate test
Testing the flow rate was an easy task thanks to the flow rate meter DigiSavant DIGIFLOW 6710M. First thing we did, it was connecting the tubes to our meter, as you can see from the picture below.
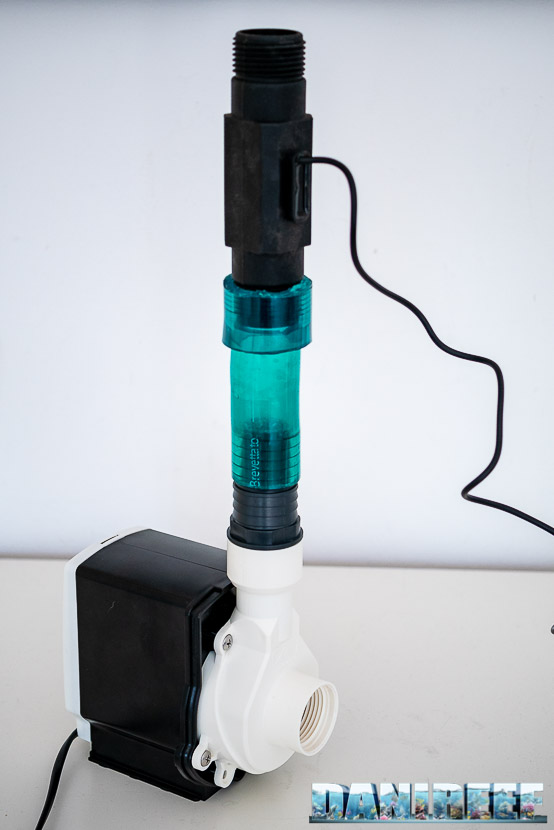
We tryed to make the meter perfectly join the exit of the pump.
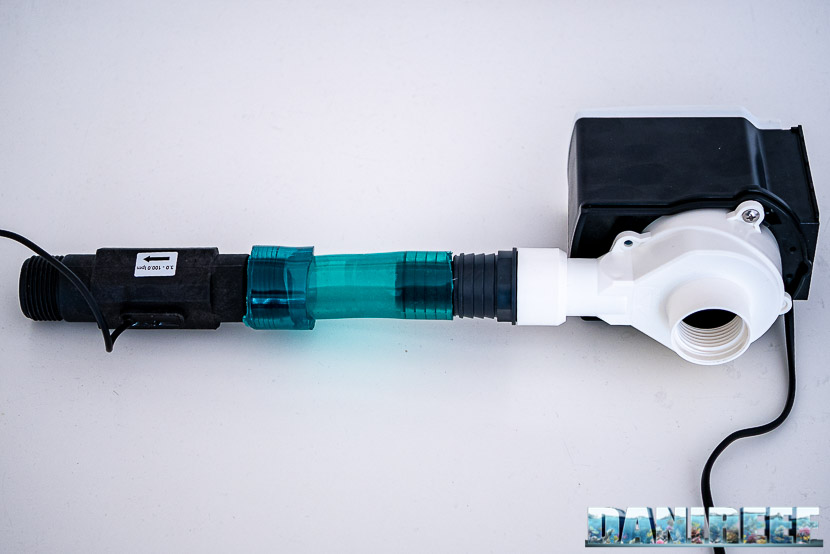
The measurement is expressed in liters/minute, so we just had to multiply the result by 60 to obtain liters per hour.
Obviously, remember that this measurement is valid for the conditions in which we did our tests. The connecting tube could have introduced some losses in the system.
This system gave us this value:
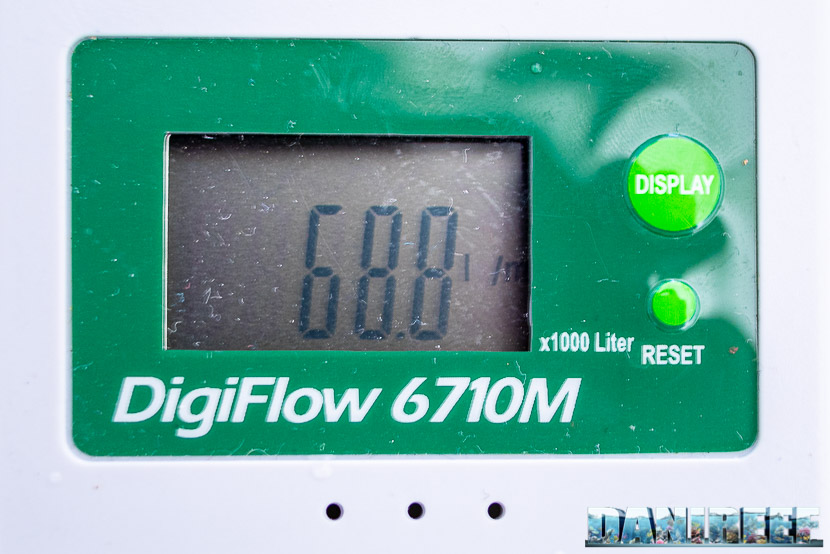
The maximum flow rate 4.128 l/h (that is 68,8 l/m*60), slightly under the declared 5.000 l/h. So the pump reached the 83% of the declared value in the conditions of the test. A great result if we consider the 66% of the Ecotech Marine Vectra M1 (article), the 67% of the Waveline DC6000 (article) or the 70% of the Hydor Seltz D6000 (article), but slightly inferior to the 86% of the sister RX 3200 (article).
When you use a return pump be careful to the aspects that may lower the flow rate, even drastically. Use the larger hose supplied. Use a sufficiently large tube. The tube should always be as short as possible and avoide 90° curves. Otherwise the flow rate will highly decrease.
Distinctive curve
The distinctive curve is that specific curve that links the various values of flow rate and hydraulic head. You can’t do this without the proper equipment. We linked the two ends of flow rate and hydraulic head, both the measured and the designed ones.
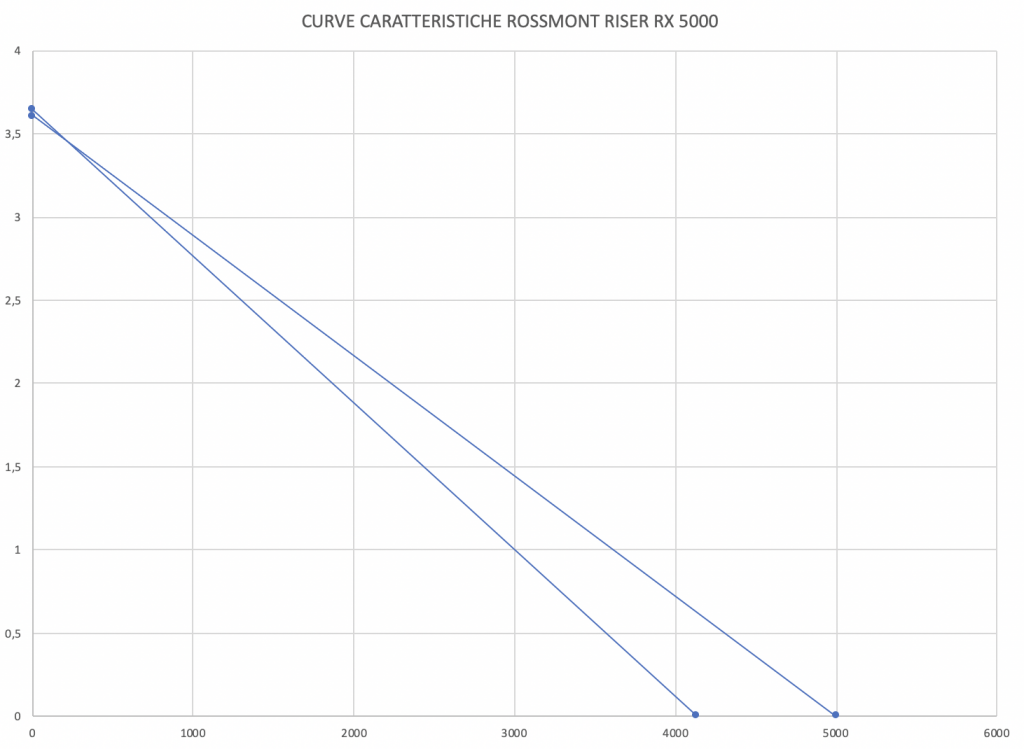
Now you can see how the difference between the declared value (the top curve) and the measurement is practically negligible.
In theory, if you put yourself at the hydraulic head value you need, for example 2 m, you should draw a line at the value of 2, see where this line crosses the distinctive line and read the corresponding flow rate value. With the Rossmont Riser RX 5000 at 2 m of hydraulic head you should have a flow rate of about 1.850 l/h against the declared 2.250. In aquarium the situation will be even worse because you have to add even the friction of the tube and the curves.
In order to calculate the flow rate of your aquarium here’s a useful link with calculator integrated: automatic calculus of the return pump (italian).
Energy consumption test
The collection of data about the consumption has been made possible by the useful device RCE PM600 that can also measure the Cos(fi) (or power factor). The result is directly given in watt.
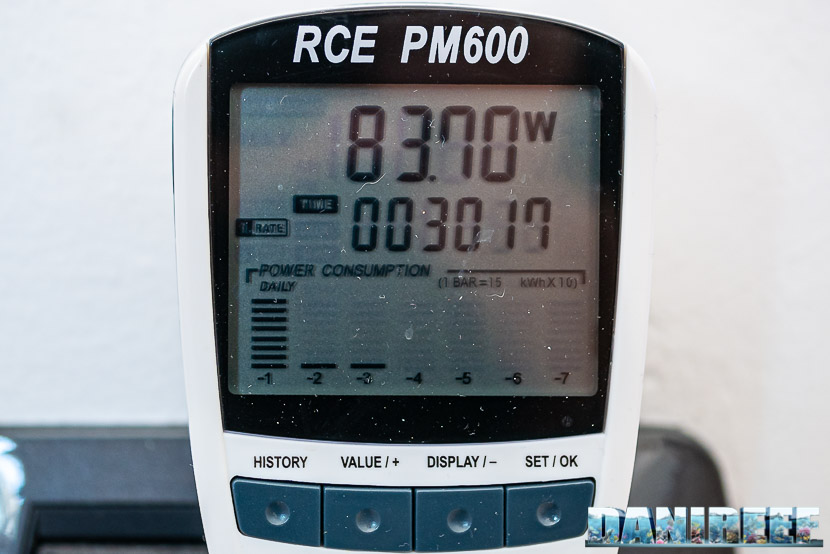
The maximum declared consumption of the Riser is 70 watt, according to our measurements the consumption is about 83,70 watt, almost the 20% over the declared value. We need to take this difference into account.
Considering that the consumption is 83,70 watt, and the energy cost is 0,27 euro per kwh, we could use this pump continuously for a whole year, at its maximum, with a consumption of 470 kwh, and a relative cost of 198 euro per year, or 16,5 euro per month.
Given the dimensions of the pump and especially its flow rate level, we couldn’t do our noise test. We can affirm that the pump is very silent, also because we’re currently using it in aquarium and otherwise we would have noticed it.


