Our new method DaniReef LAB for PAR measurement
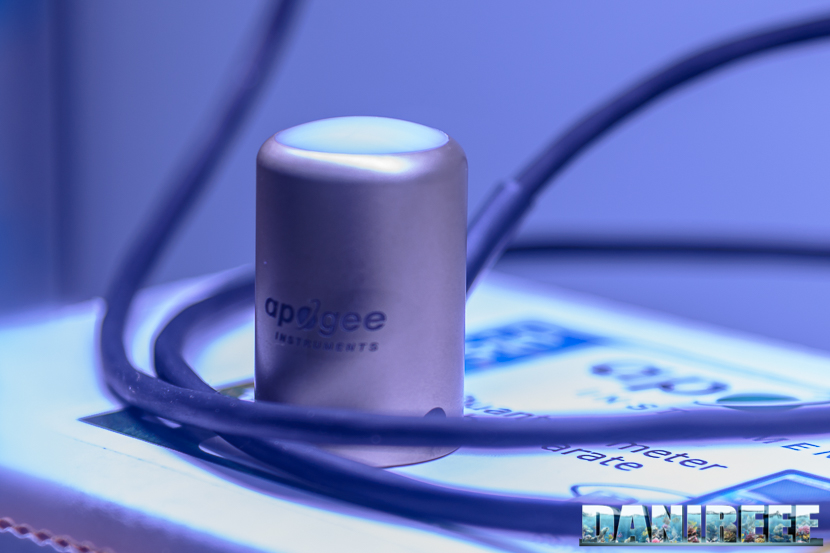
Antecedent: (this paragraph is the same for every ceiling light we tested in our DaniReef LAB and it’s used to explain the method of work) During the long nights spent on our forum (here) we always wondered how could we compare PAR from different ceiling lights. Even though we had the perfect device, the Quantum Meter MQ-510 di Apogee, we always referred only to the value measured at the centre at 20 cm of distance, more or less.
The Quantum Meter MQ-510 measures the PAR, expressed in PFFD that is photosynthetic photon flux density in μmol m-2 s-1. This device is calibrated to work underwater, so if it’s in air the measured value has to be divided by 1,32 that’s the dive factor. We have to do the conversion. The values you’re going to see are correct.

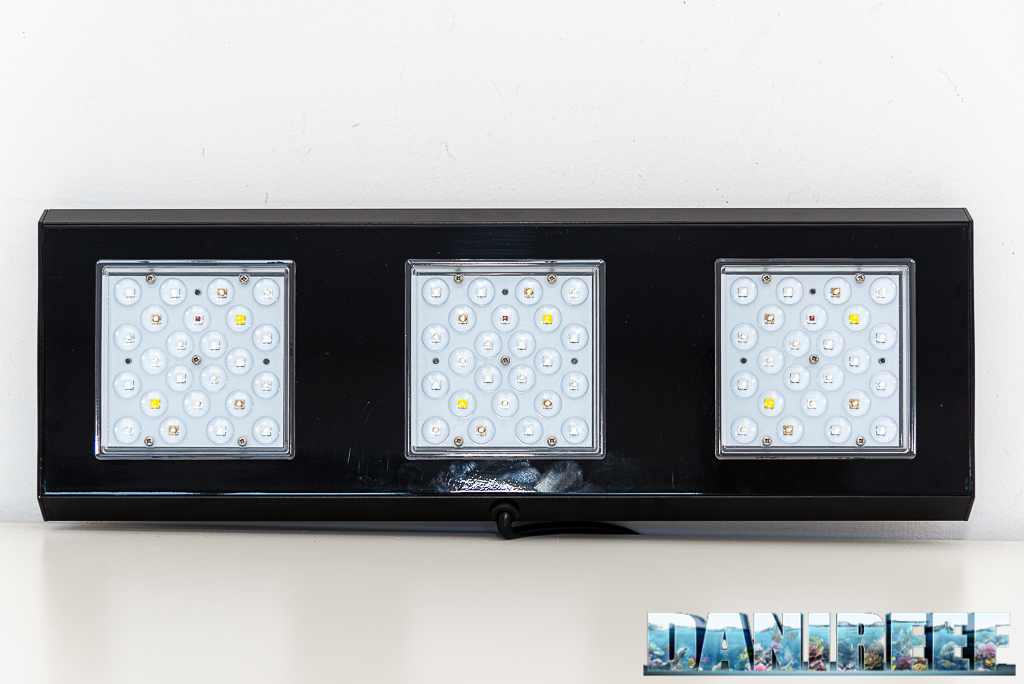
We decided to make a square base of 70×70 cm, we set 17 fiducial points where we placed the sensor Quantum Meter MQ-510 and we also made 3 lifts of 20, 40 and 60 cm for the ceiling light, in order to have the same distance from the sensor. This will allow us to create the curves which can be compared to other ceiling lights’s, all tested at the same distances. Notice that this distance is measured between the base of the sensor and the ceiling light. In reality it should be decreased of 3,5 cm that is the height of the measurement cylinder and increased by 0,5 cm that’s the dimension of the spacers that lift the ceiling light.
In total the three measurements are made from 17, 37 and 57 cm of distance. Because they’ve been done in air they will be corrected.
PAR measurement from 17 cm of distance
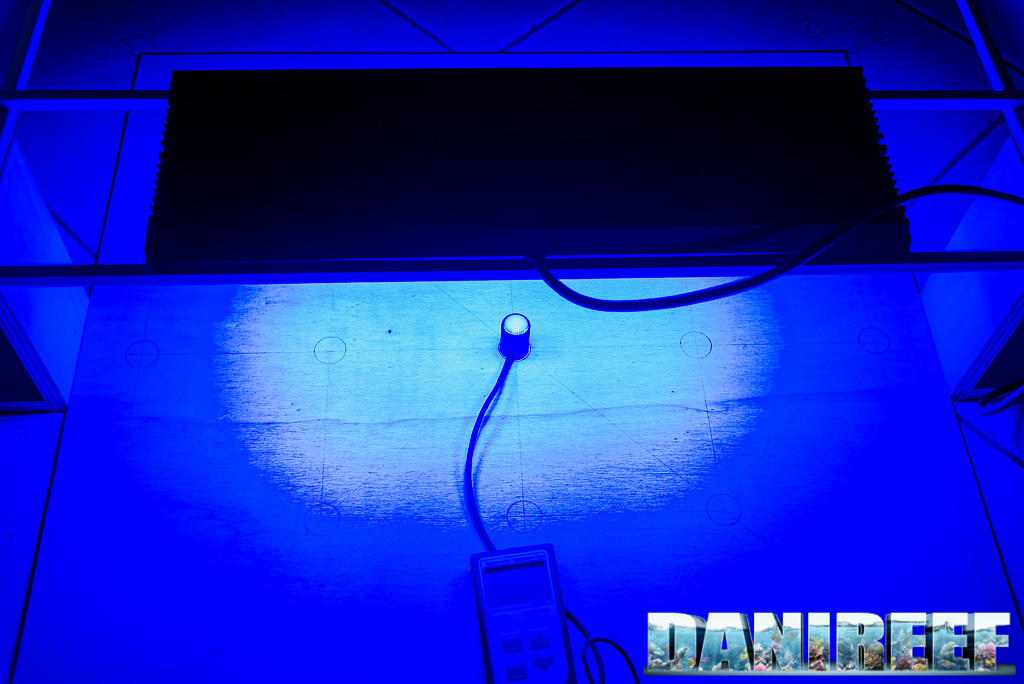
The ceiling light has been placed at 17 cm of the display. The points not indicated on the panel have been estimated in the following chart.
Here the collected values:
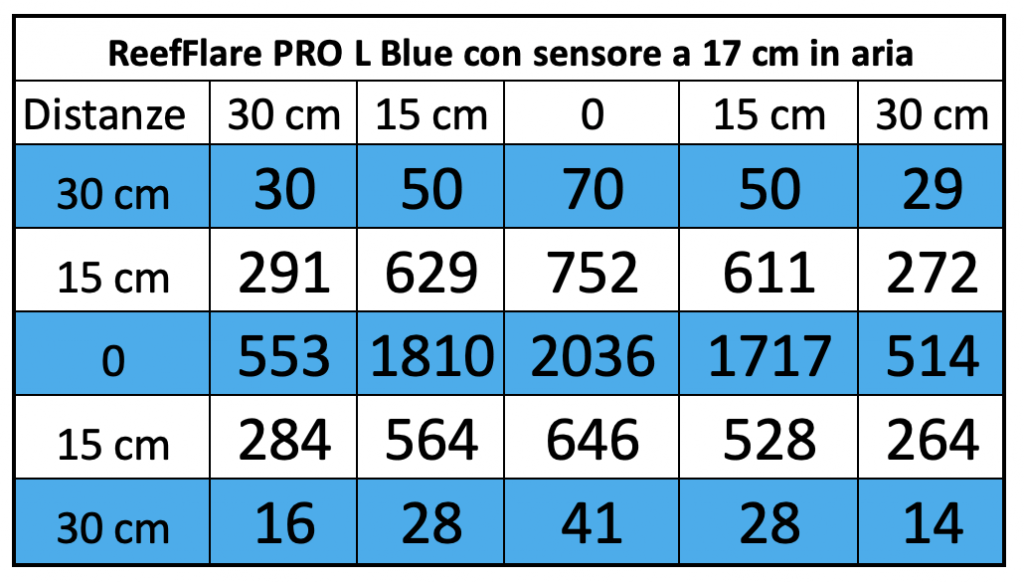
And this is the corresponding chart. We are using the same scale for ceiling lights with similar power.
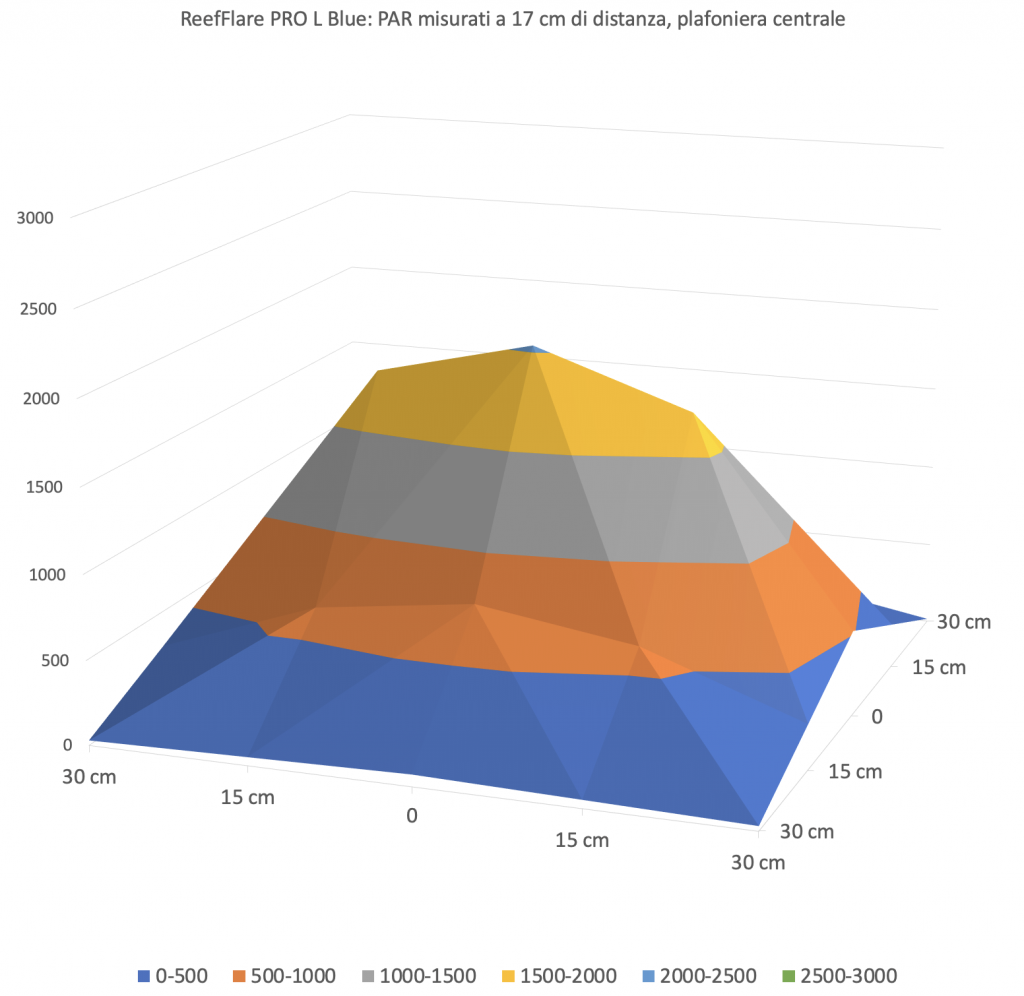
The first measurement has a short distance between the sensor and the ceiling light. The values of the expressed PAR are very high in the middle but especially very present for the whole length, while they decrease a bit abruptly on front and behind. This was to be expected considetring that the ceiling light is 61,5×23,8 cm.
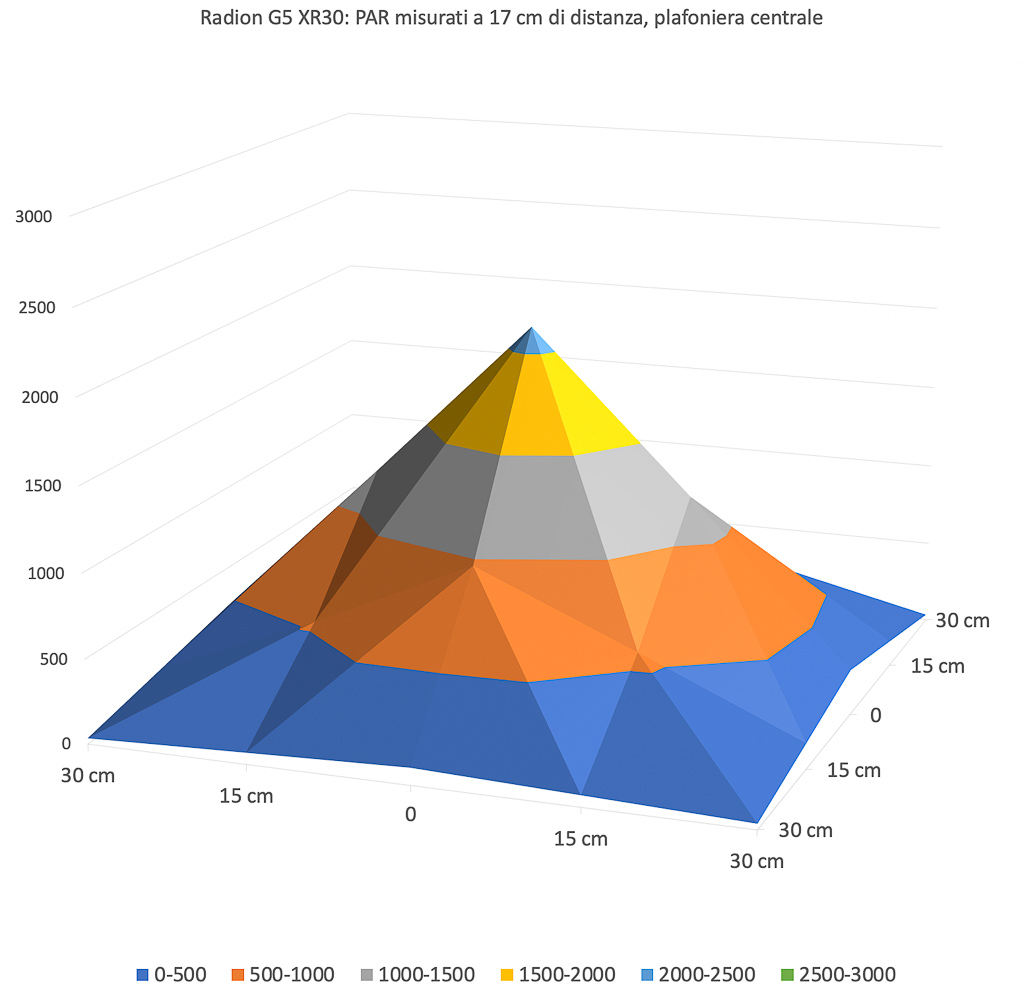
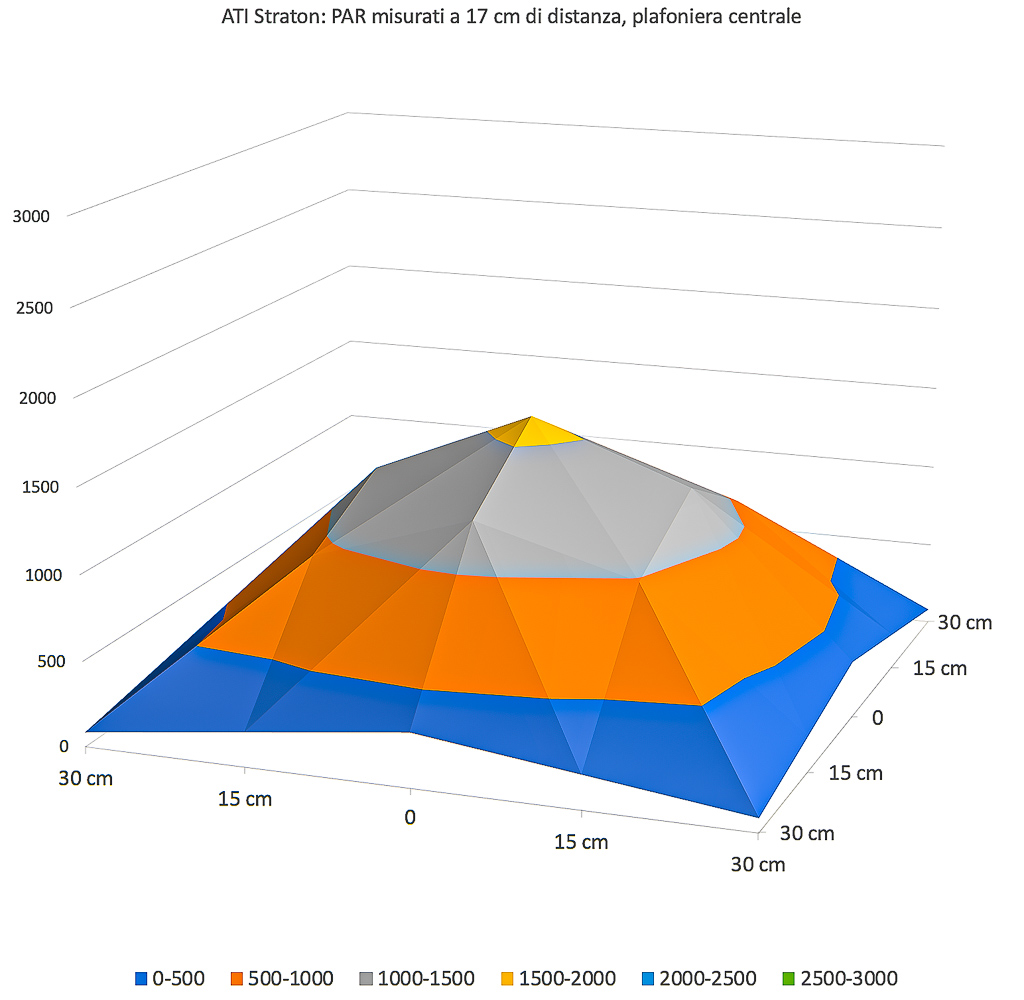
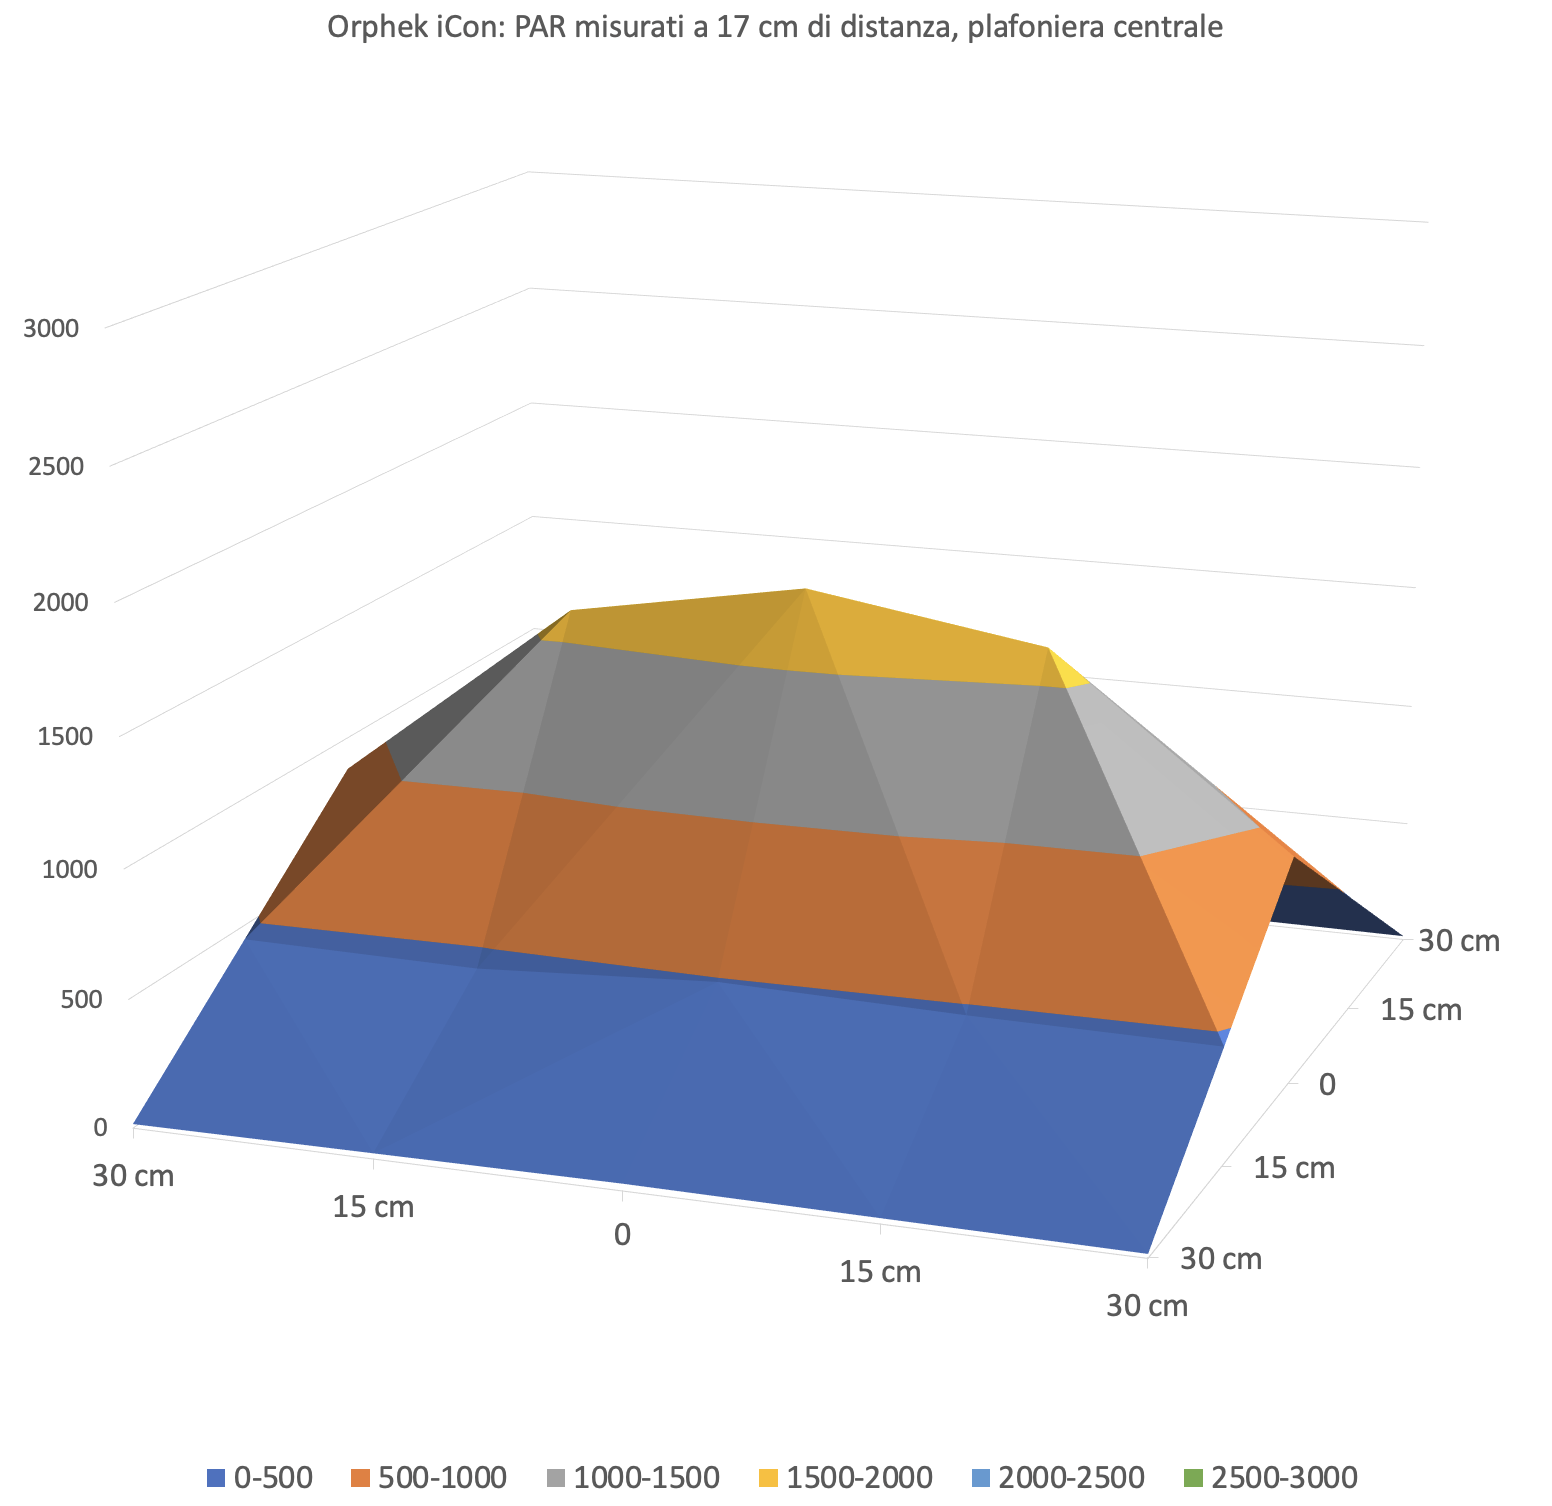
The graphs have the same scale and where the PAR are similar they have the same color. From the comparison with other three ceiling lights of the same class, even if the consuptions are a bit different, it stands out that the Radion has a higher power peak, and a slightly wider distribution. The ATI has less central power but a more uniform coverage. Orphek has slightly less peak power but covers better all the sides. Consider that the consumptions are different for all the ceiling lights: 170 for the Reef Flare L Blue, 211 for the ATI Straton, 203 for the Radion and 229 for the Orphek iCon.
PAR measurement from 37 cm of distance
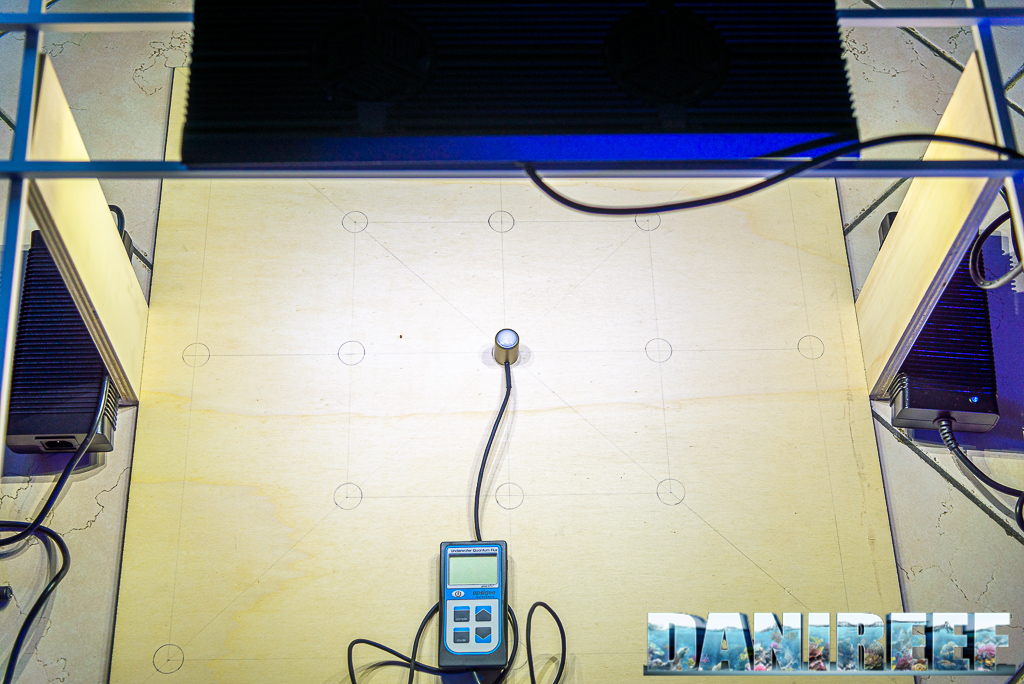
Then we placed at 37 cm of distance.
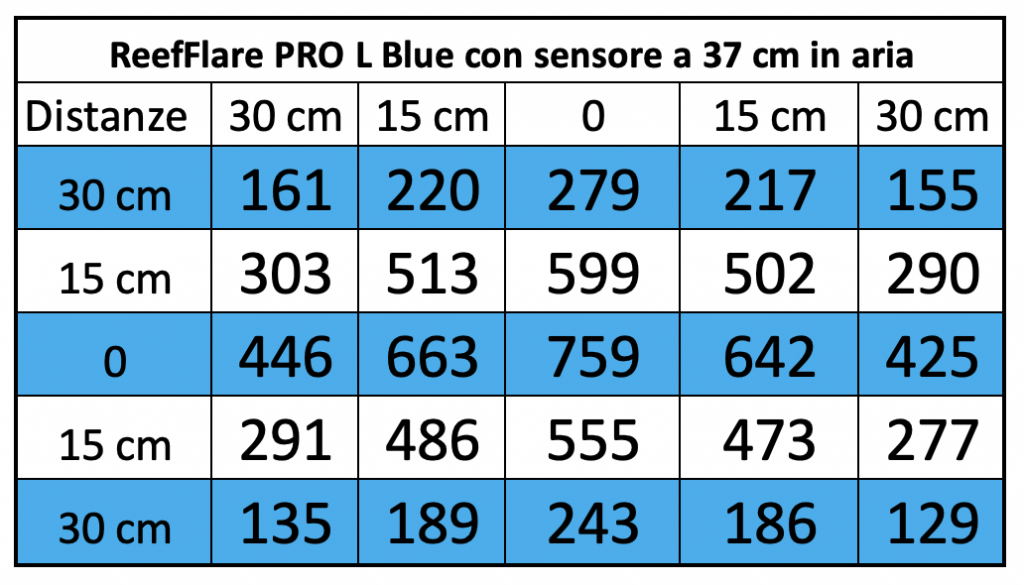
Here the collected values:
And this the corresponding chart:
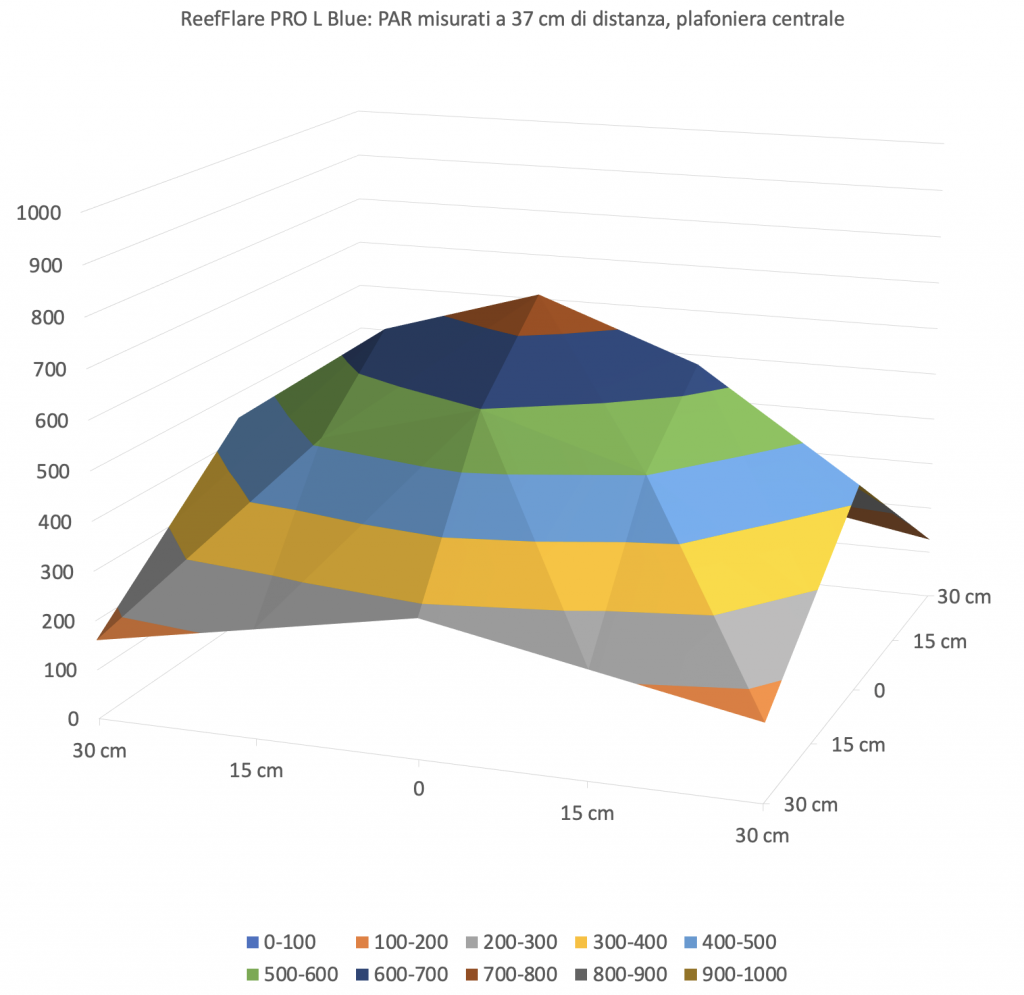
With a bigger space between ceiling light and sensor, the curve takes on a full connotation. The peak value is very high. The value at the middle decreases from 2036 to 759 μmol m-2 s-1.
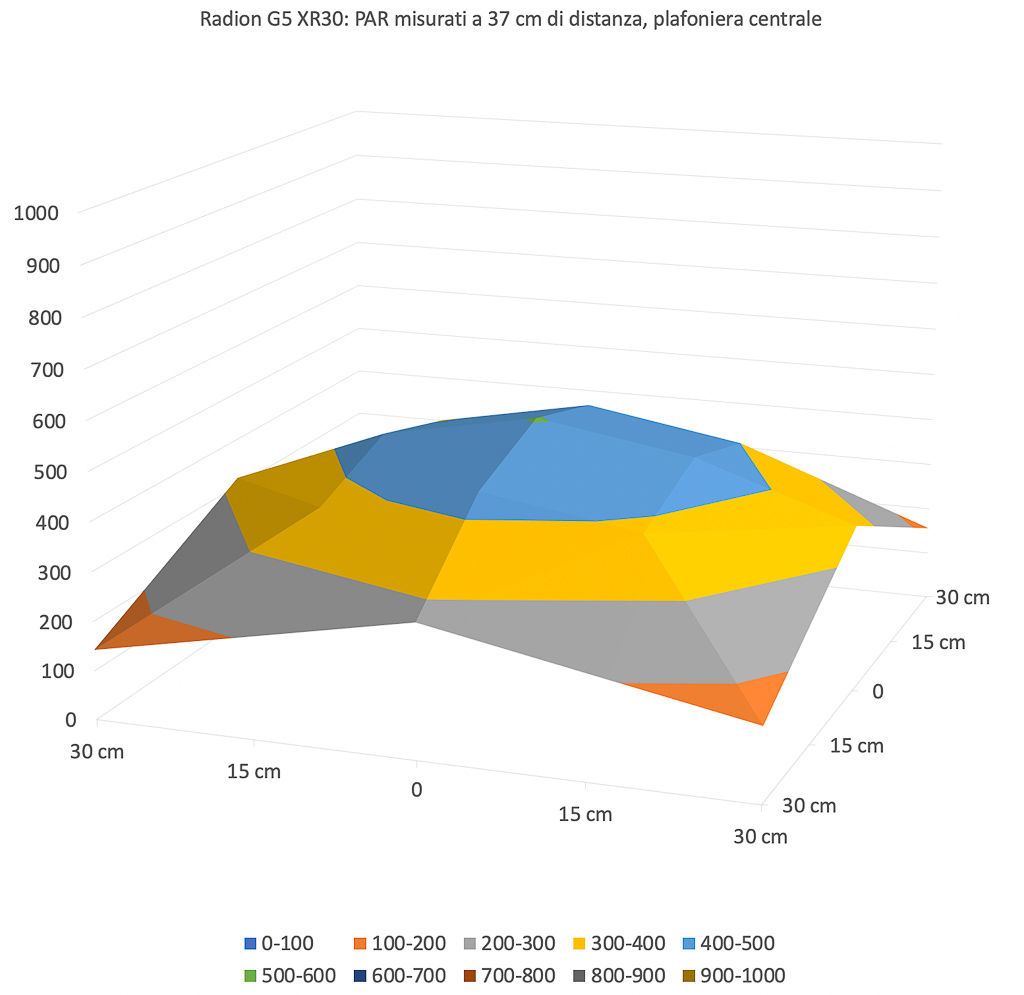
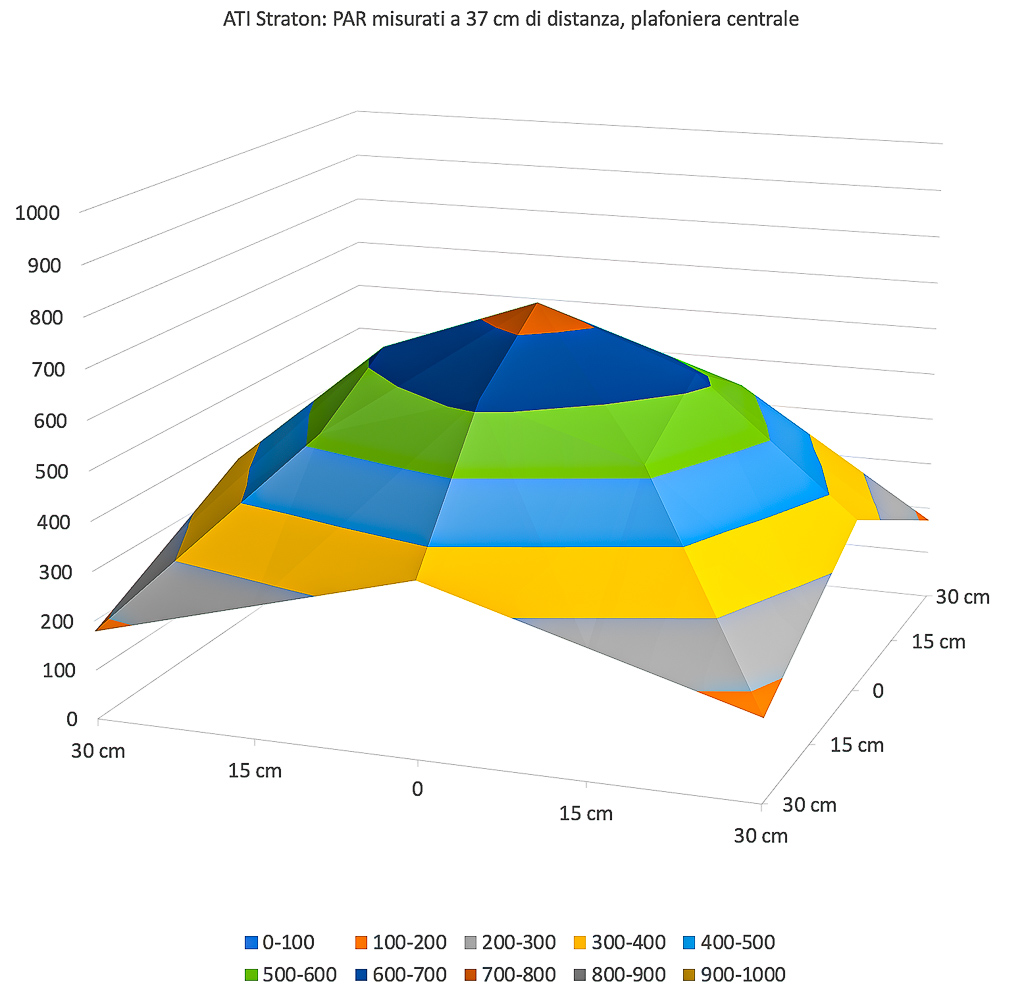
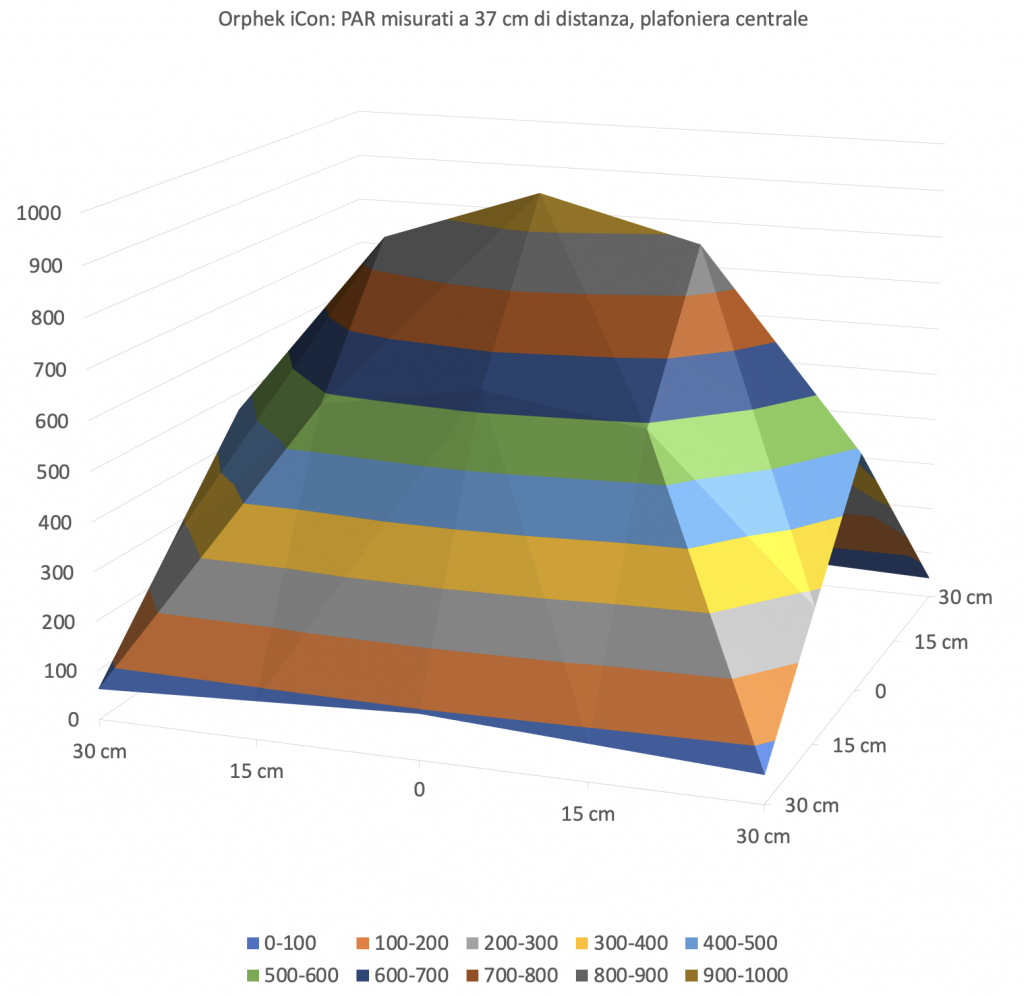
At 37 cm from the ceiling light the graph of the Reef Flare PRO L Blue gets really full and assumes the elongated shape of the ceiling light. At this distance the coverage curve is practically ideantical to the ATI Straton and it’s more powerful than the Radion. Orphek has a greater number of PAR. We have also to consider the curve based on the power consumption. In fact, the power consumptions are different for every ceiling light: 170 for the Reef Flare L Blue, 211 for the ATI Straton, 203 for the Radion and 229 for the Orphek iCon.
PAR measurement from 57 cm of distance
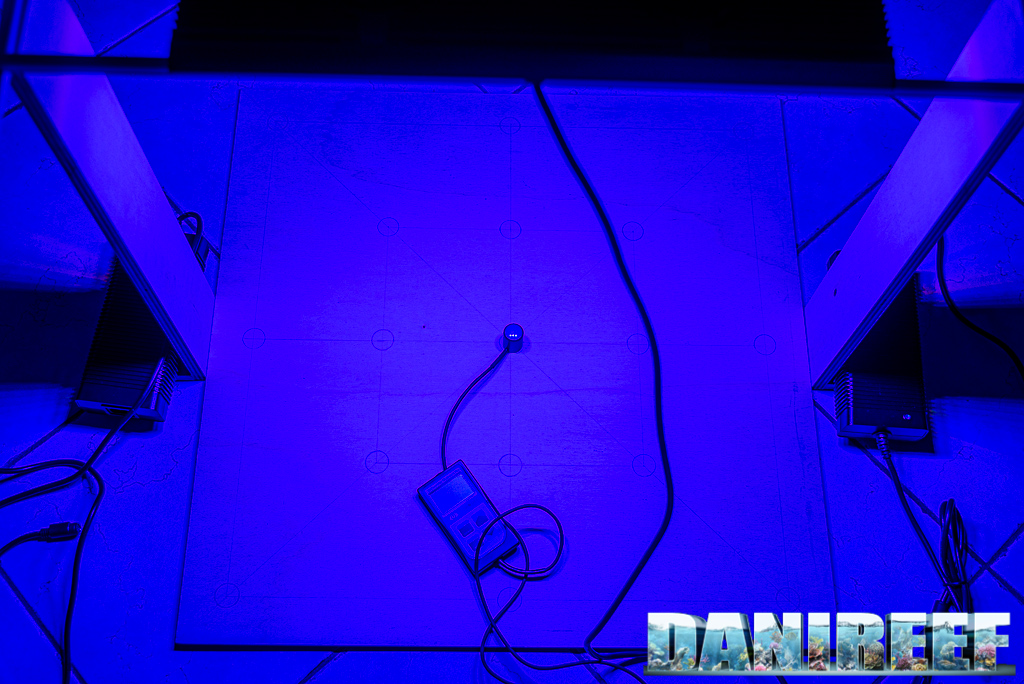
Than we placed further, at 57 cm.
These are the collected values:
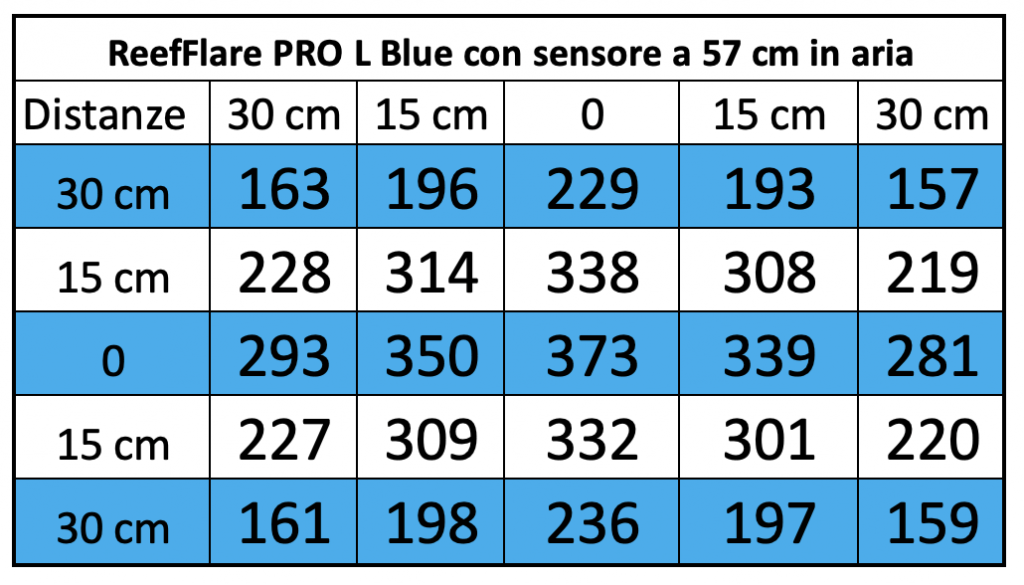
And this is the corresponding chart:
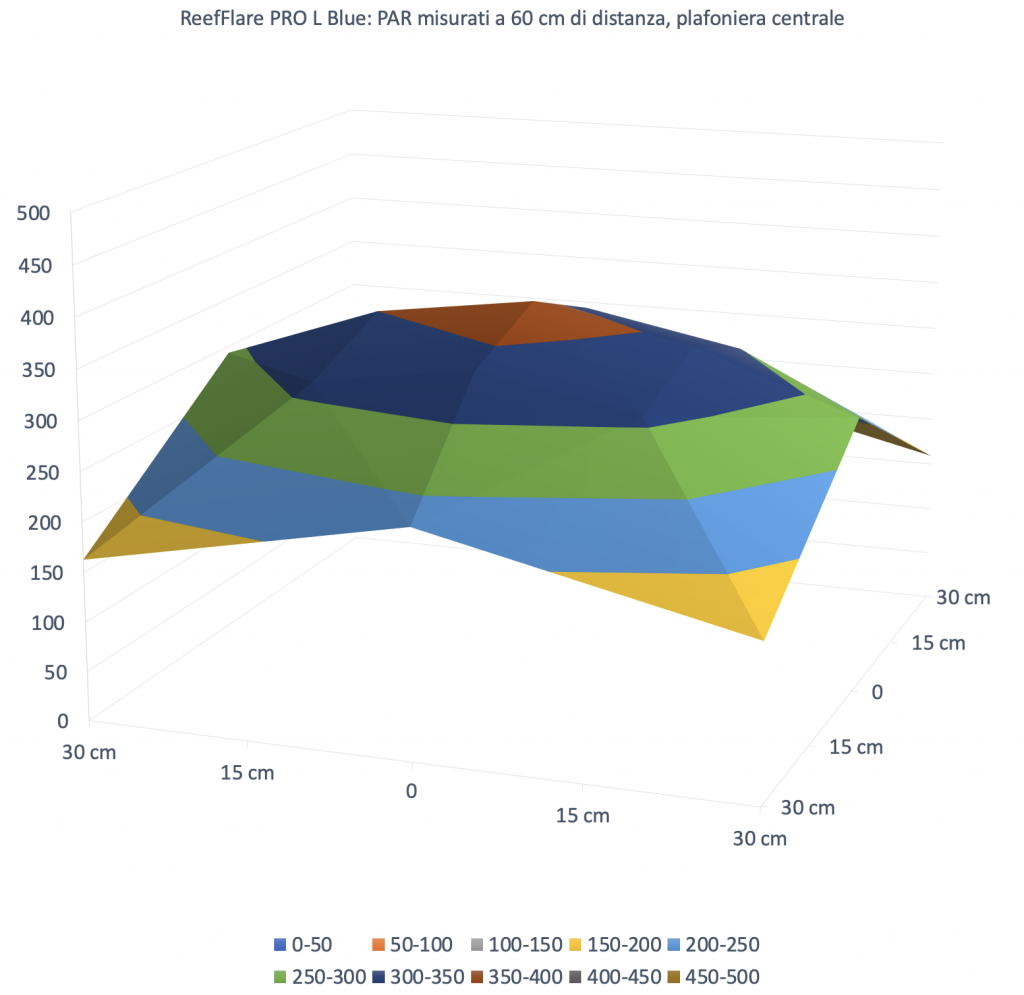
It’s enough to look at the graph to see the power expressed through the central line of the ceiling light. The value in the middle decreases from 2036 to 759 to 373 μmol m-2 s-1.
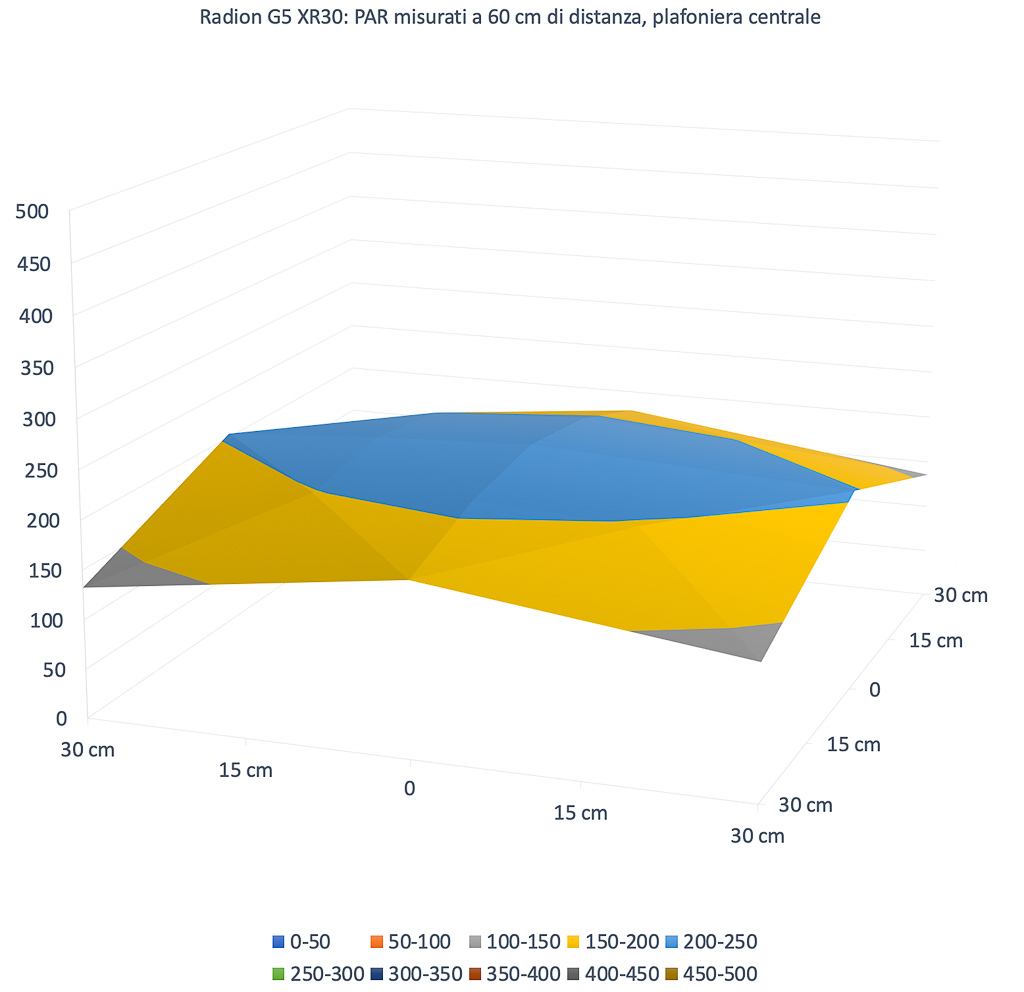
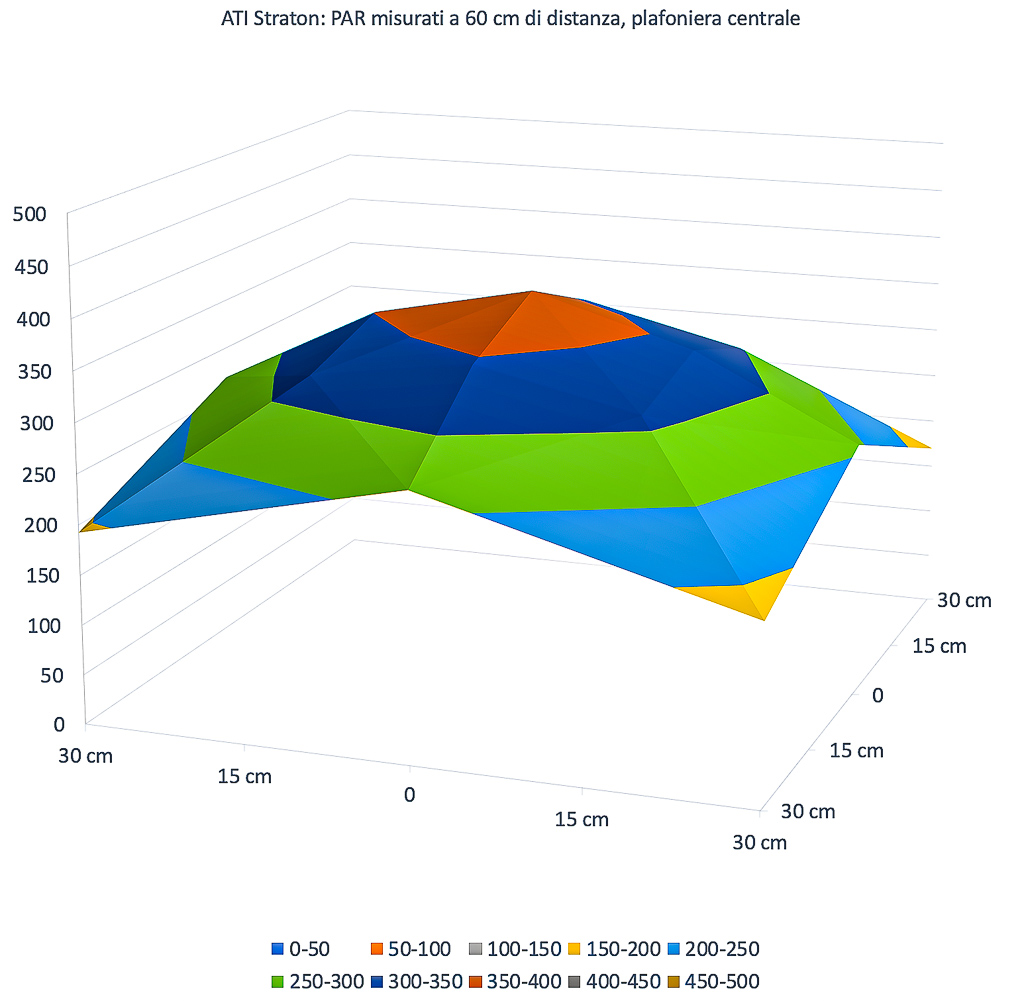

The differences are the same at 37 cm. The coverage is the same of the ATI Straton, bigger than the Radion but less than the Orphek. Always consider the curve based on the power consumption. In fact, the power consumptions are different for every ceiling light: 170 for the Reef Flare L Blue, 211 for the ATI Straton, 203 for the Radion and 229 for the Orphek iCon.
The PAR in the middle in the different configurations
Let’s continue with our technical measurements. We can see how, in a chart, the PAR collected in the middle decrease in the three different distances of our tests.
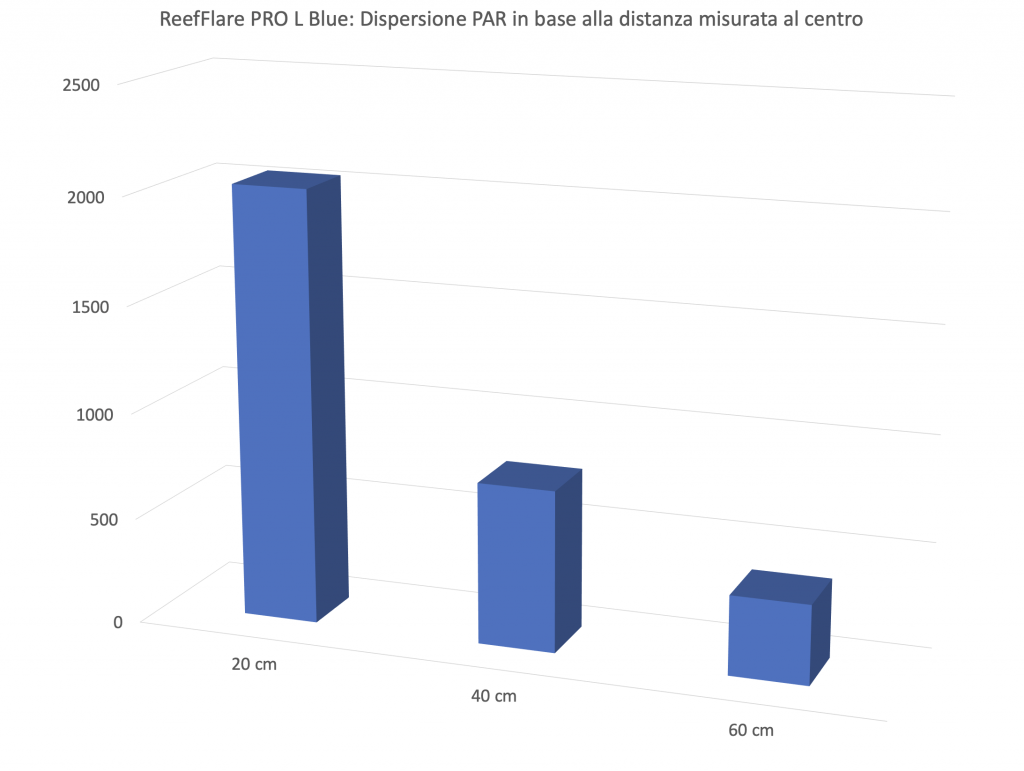
Energy variation of the Reef Flare Pro L Blue depending on the distances
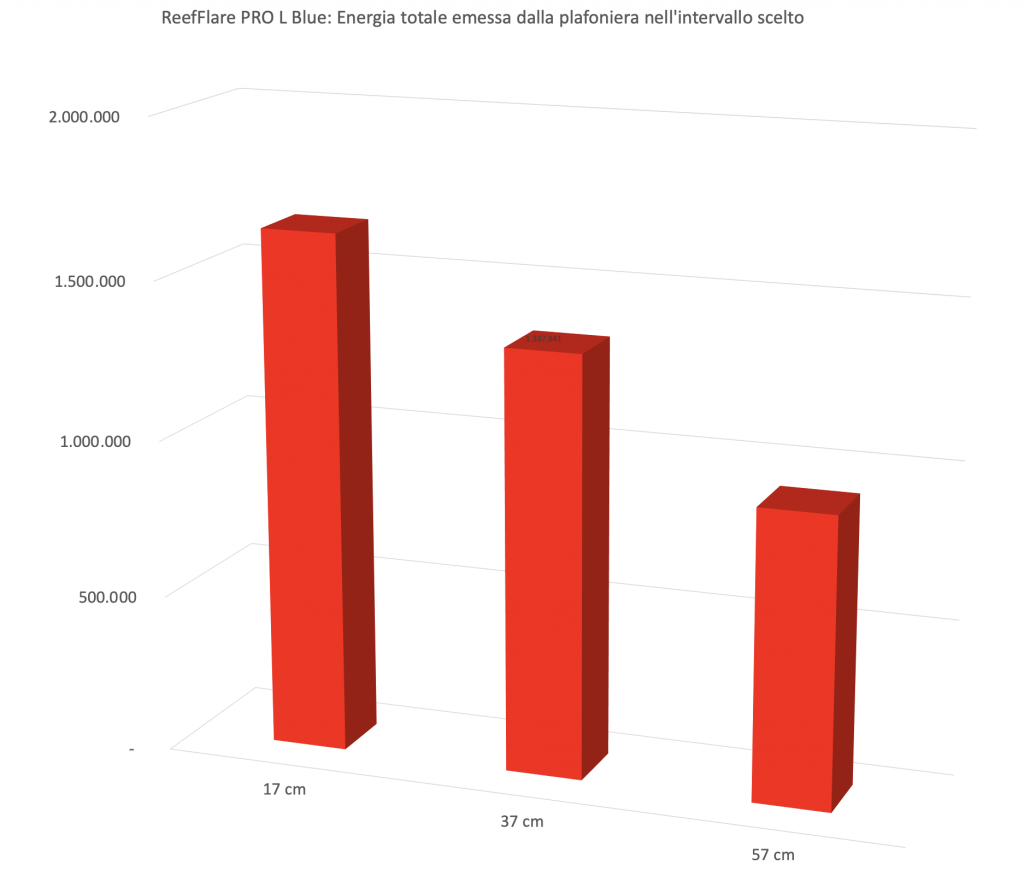
This is the most significant and most comparable data: the energy variation. We calculated the volumes of the three surfaces previously seen. It’s obvious that moving away from the ceiling light the PAR decrease, also because the light illuminates a wider space. In this way you can consider all the light energy contained in the 60×60 cm area subtended by the ceiling light. And the three values of 1.469.474, 1.286.030 and 1.155.746 assume a different connotation compared to the values in the middle. When the first ones decrease because of the increasing of the distances, the subtended area, that is the energy, decreases less.
For this ceiling light the values are almost the same in the three distances. This means that the whole light expressed or the main part, stays inside the 60 cm. Great for tanks until 60 cm, less for aquarium of 70 or 80 cm.
Values per channel in the middle in the three distances
We also measured the values per each channel, but only in the middle, in order to give you an idea of the contribution of the different channels on the PAR produced.
Let’s see the collected values:
| Distance = 17 cm | Distance = 37 cm | Distance = 57 cm | |
| Channel 1: UV (400 nm) | 136 μmol m-2 s-1 | 55 μmol m-2 s-1 | 28 μmol m-2 s-1 |
| Channel 2: Violet (420 nm) | 335 μmol m-2 s-1 | 126 μmol m-2 s-1 | 63 μmol m-2 s-1 |
| Channel 3: Indigo (450 nm) | 367 μmol m-2 s-1 | 131 μmol m-2 s-1 | 65 μmol m-2 s-1 |
| Channel 4: Blue (470 nm) | 761 μmol m-2 s-1 | 282 μmol m-2 s-1 | 140 μmol m-2 s-1 |
| Channel 5: Green (530 nm) | 48 μmol m-2 s-1 | 17 μmol m-2 s-1 | 8 μmol m-2 s-1 |
| Channel 6: Red (660 nm) | 145 μmol m-2 s-1 | 56 μmol m-2 s-1 | 28 μmol m-2 s-1 |
| Channel 7: White (5.700°K) | 270 μmol m-2 s-1 | 103 μmol m-2 s-1 | 52 μmol m-2 s-1 |
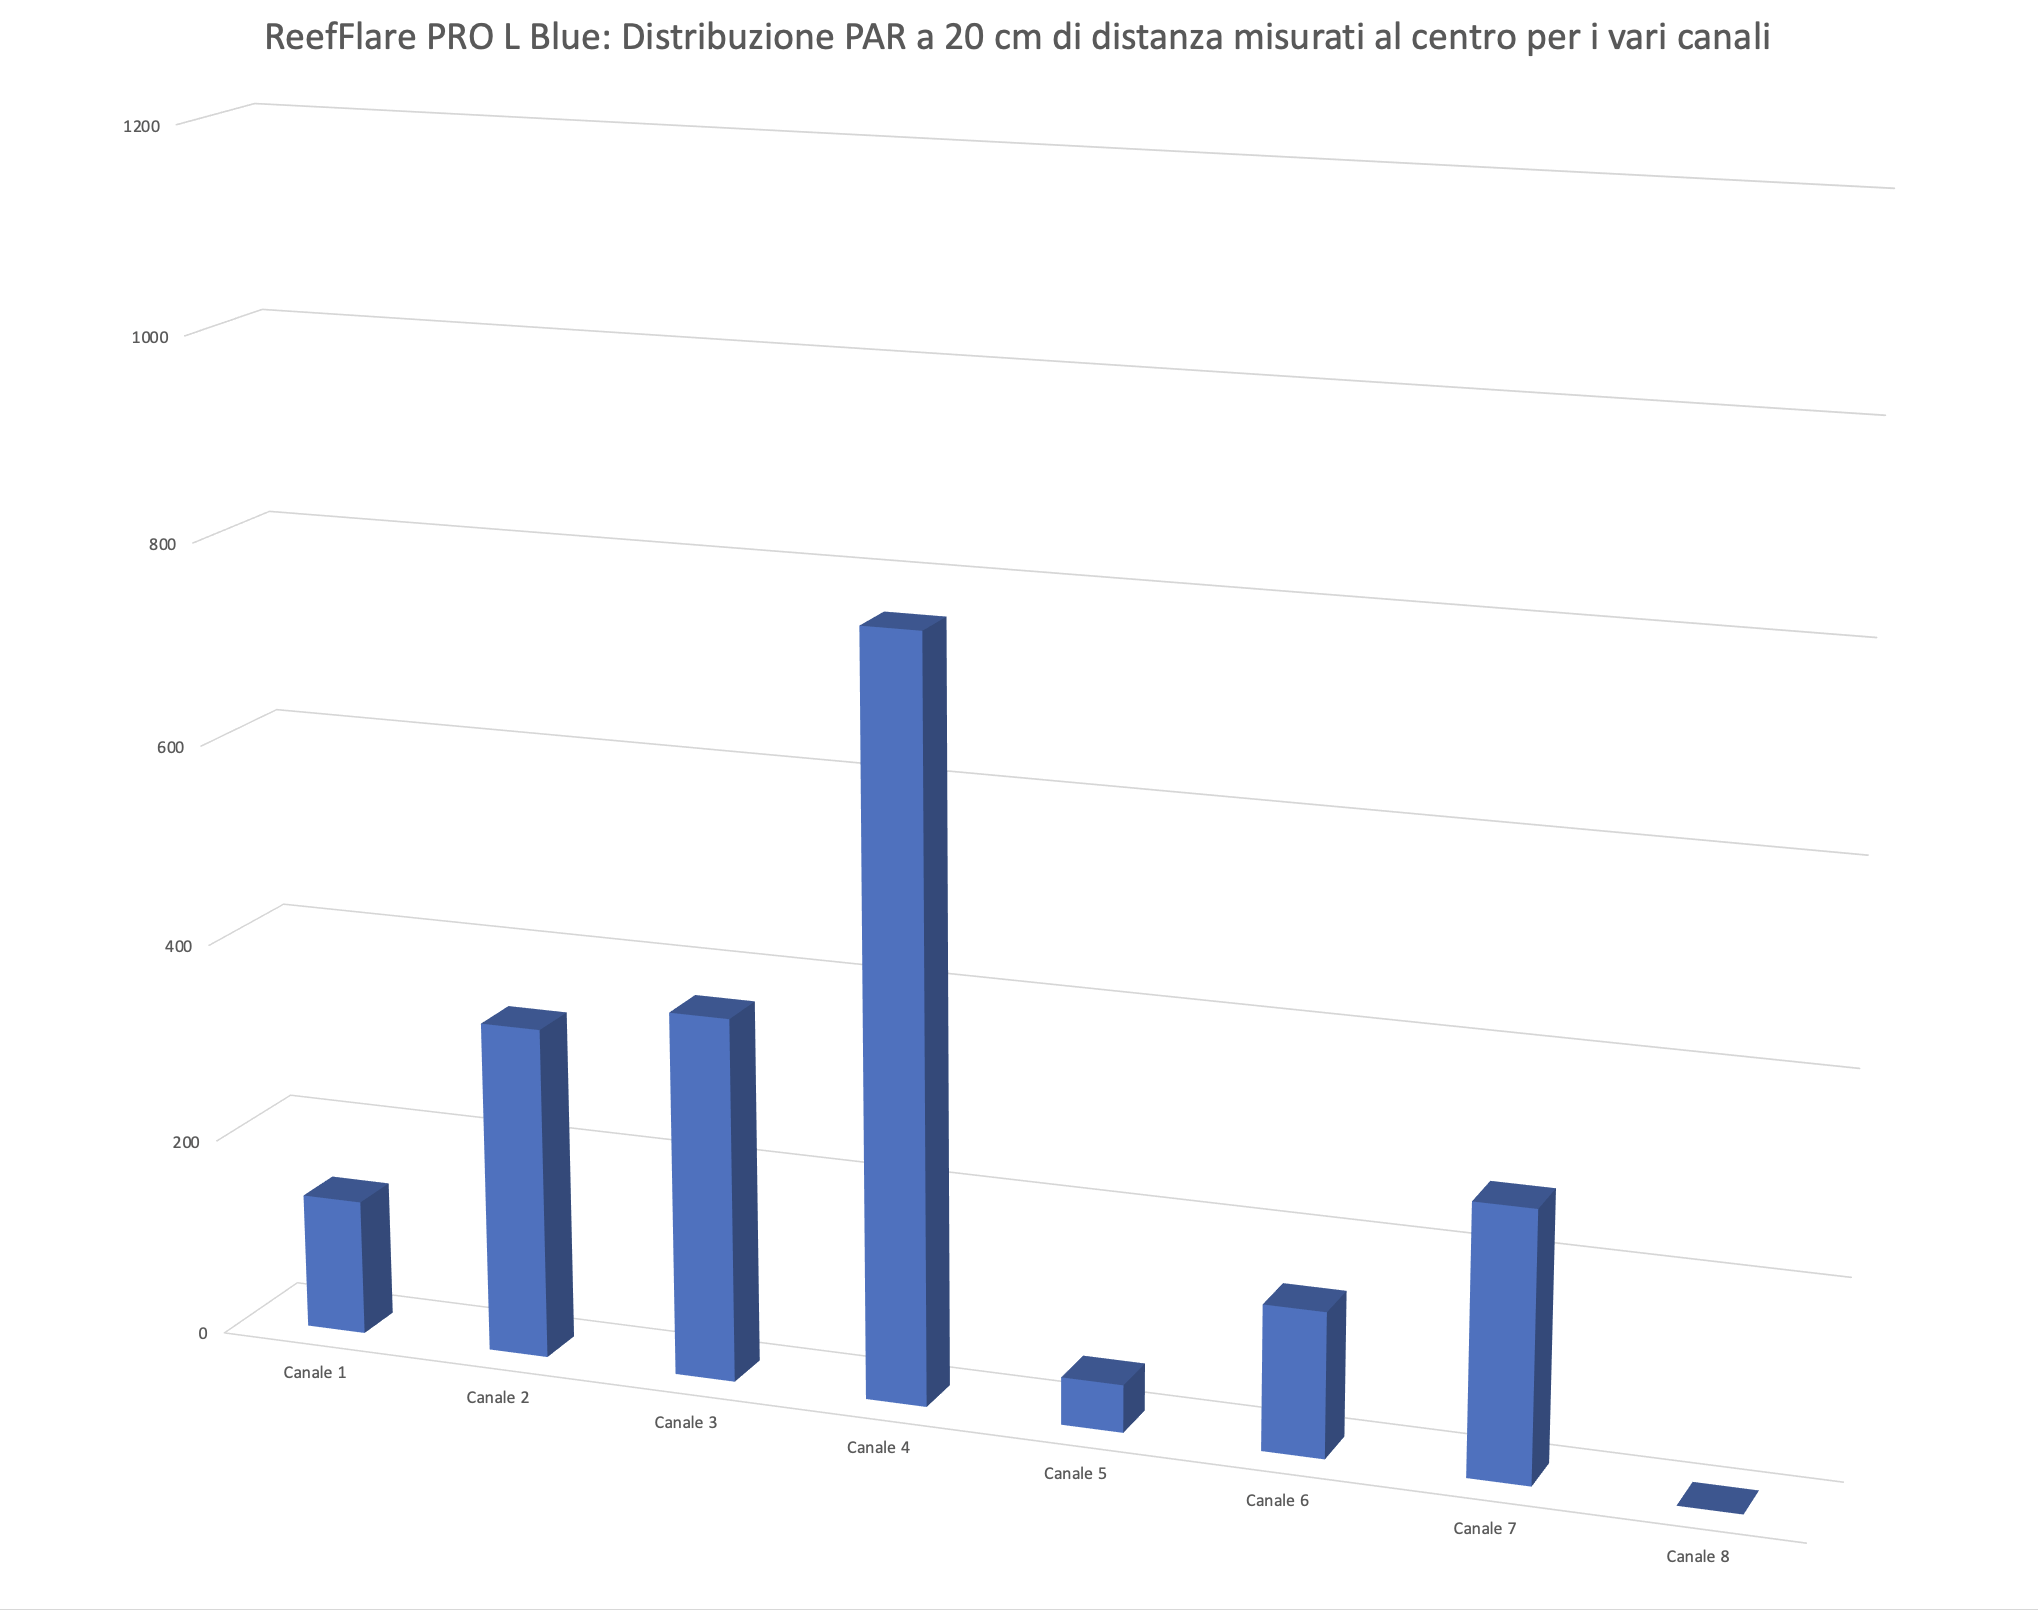
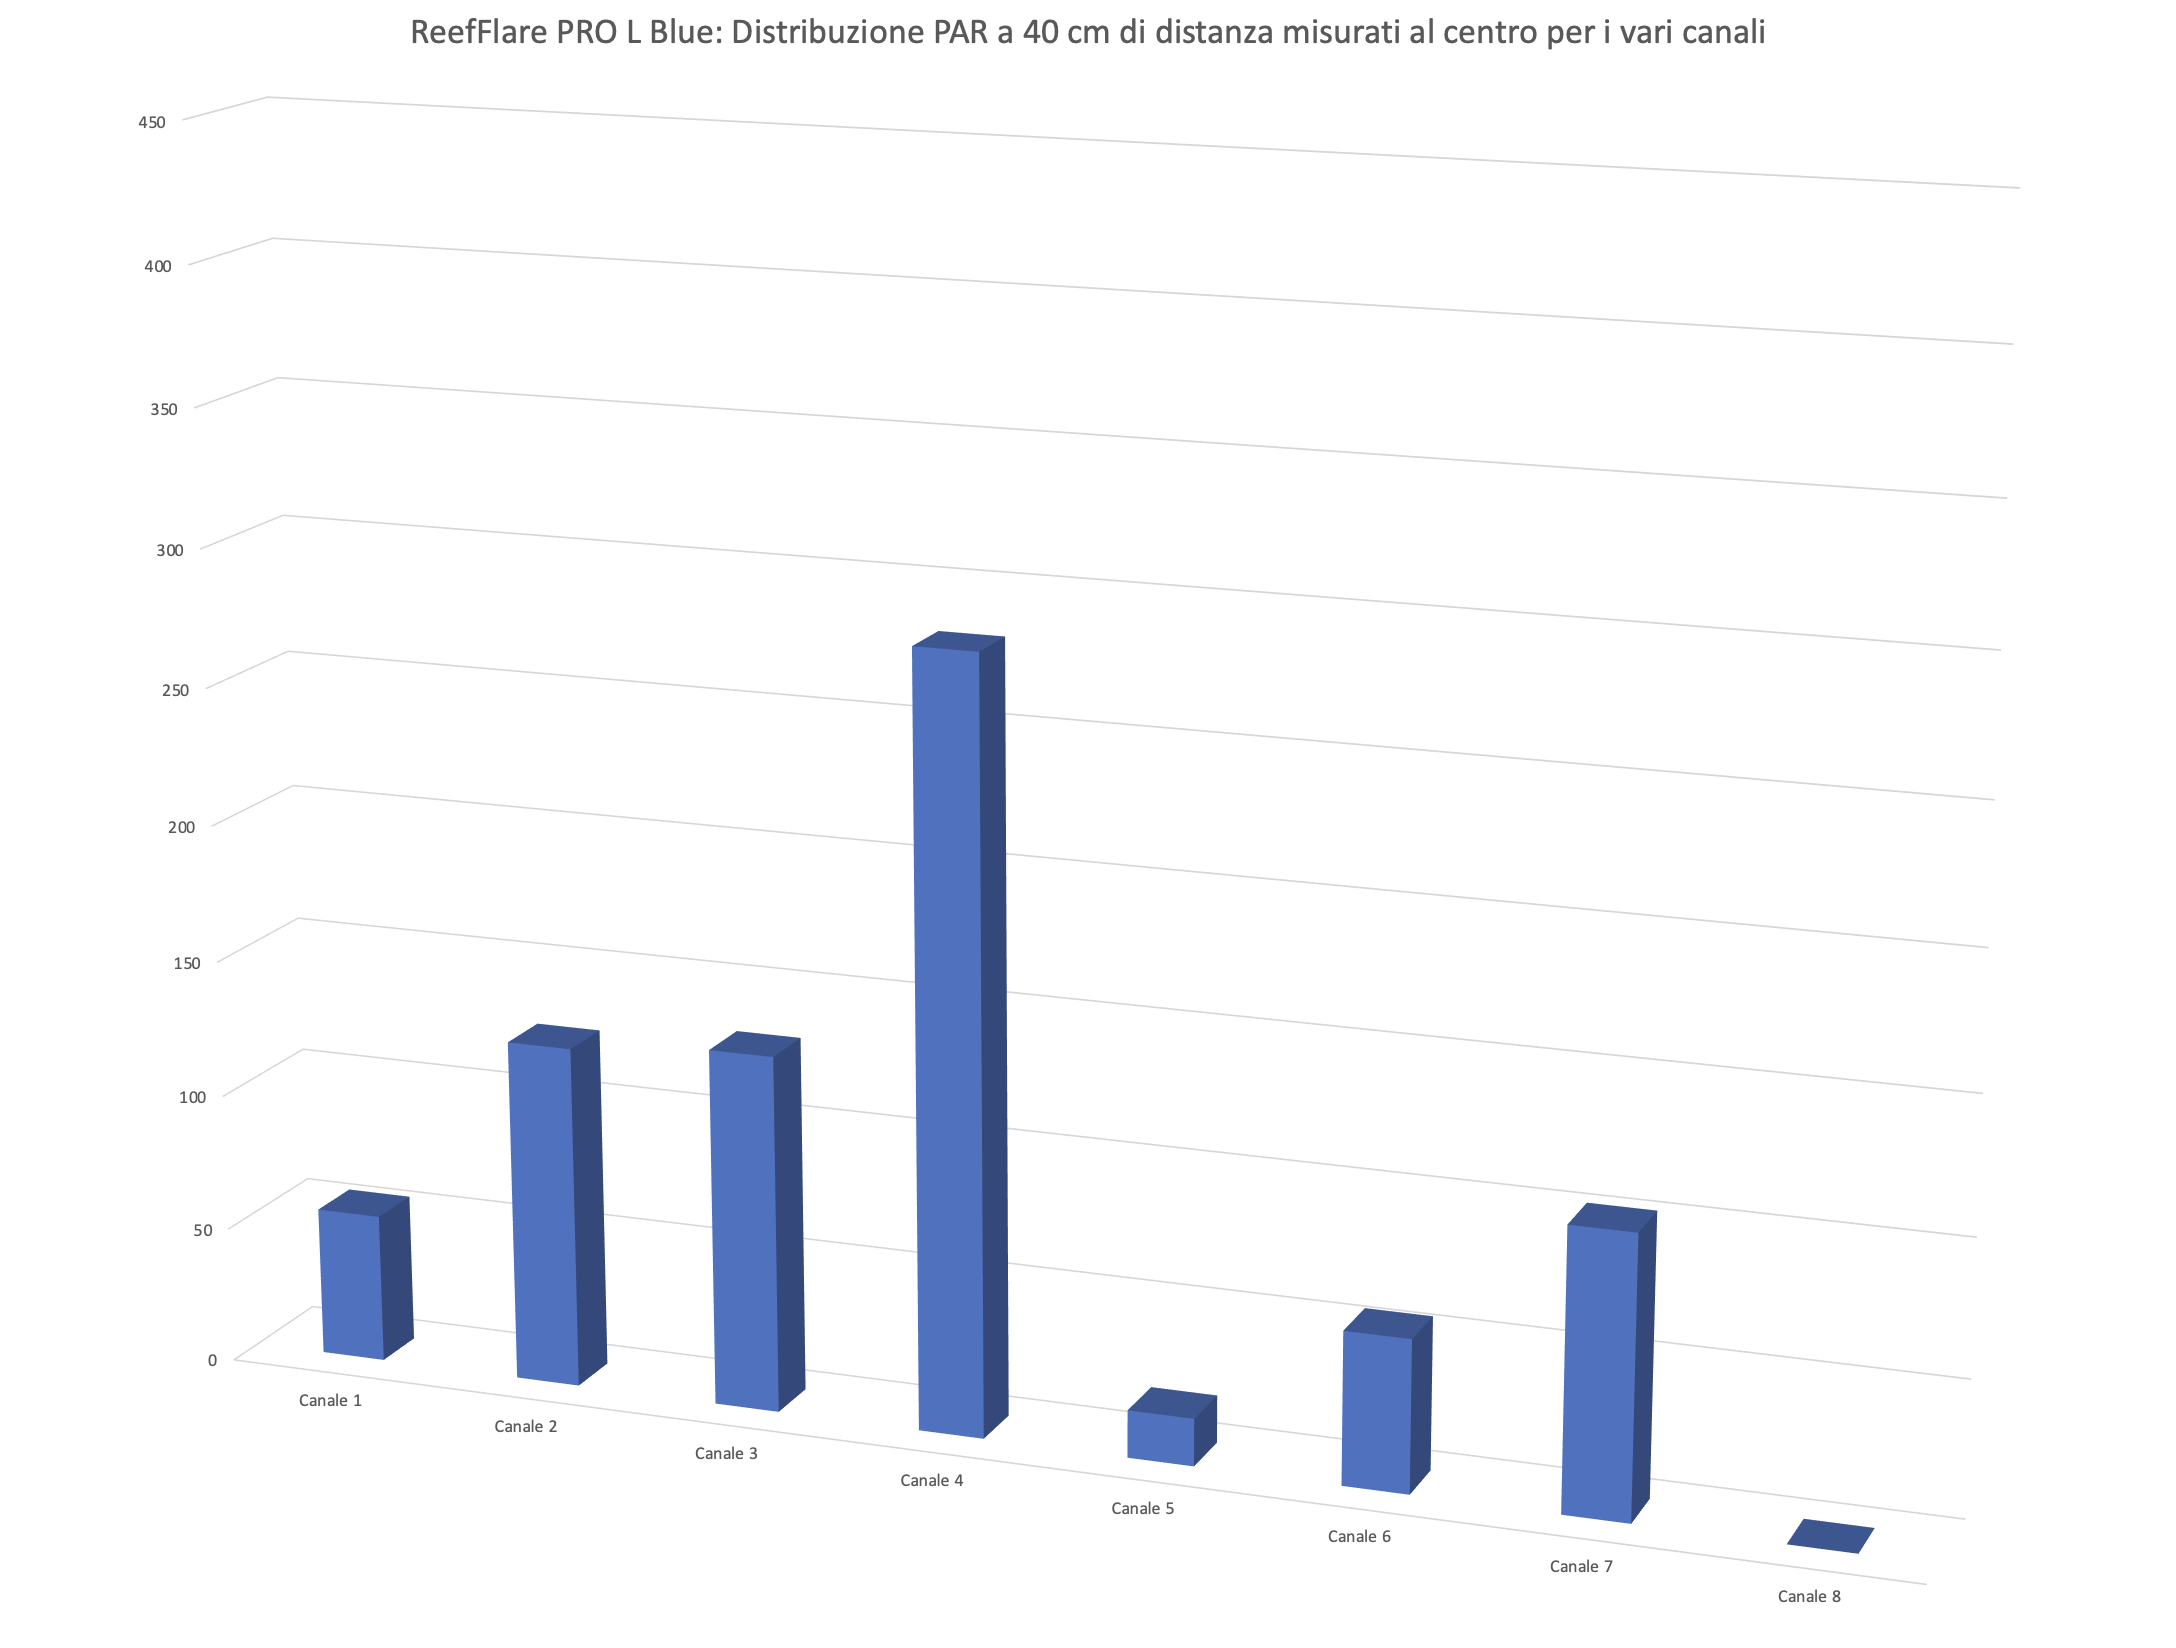

The seven channels are pretty different. But you can see how the Channel 4 Blue is the king with the main part of the PAR. But also the Channels 2, 3 and 7 have almost the same PAR value and have a bigger impact than the others.
Power consumption
The measurement of the consumption was made possible thanks to the useful device RCE PM600 that can also measure the Cos(fi) (or power factor). The result is already given in watt.
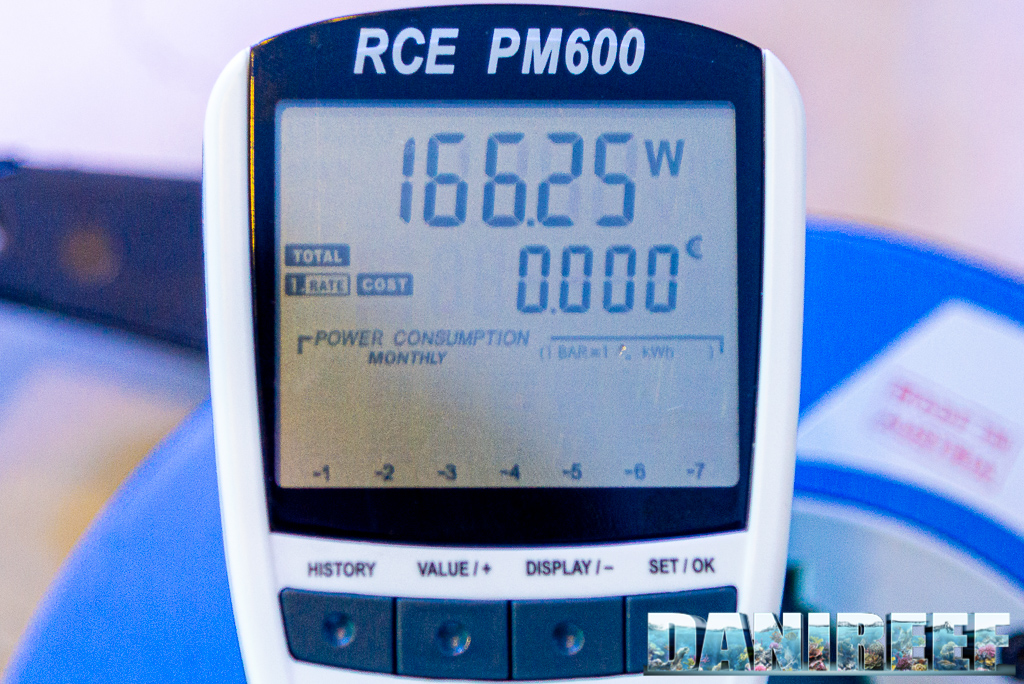
Here above there’s the maximum power and then the Cos(fi).
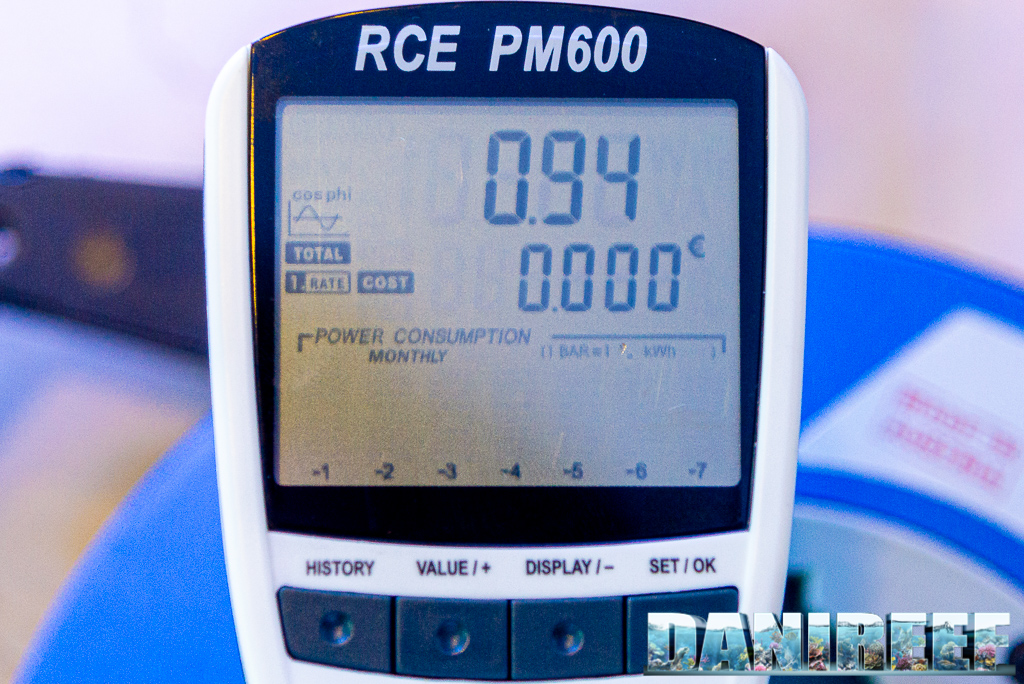
The Reef Flare PRO L Blue consumes only 166,25watt rather than the 240 watt declared. On one hand, this is surprising because the gap is considerable, on the other is stunning, given the number of PAR. So little consumption for so many PAR! Considering that at 17 cm the ceiling light has at the middle 2036 μmol m-2 s-1, we can say, in perspective, that it will be a peak value of 12,25 μmol m-2 s-1 w-1 (PAR per watt).
Reef Flare PRO L Blue and heat
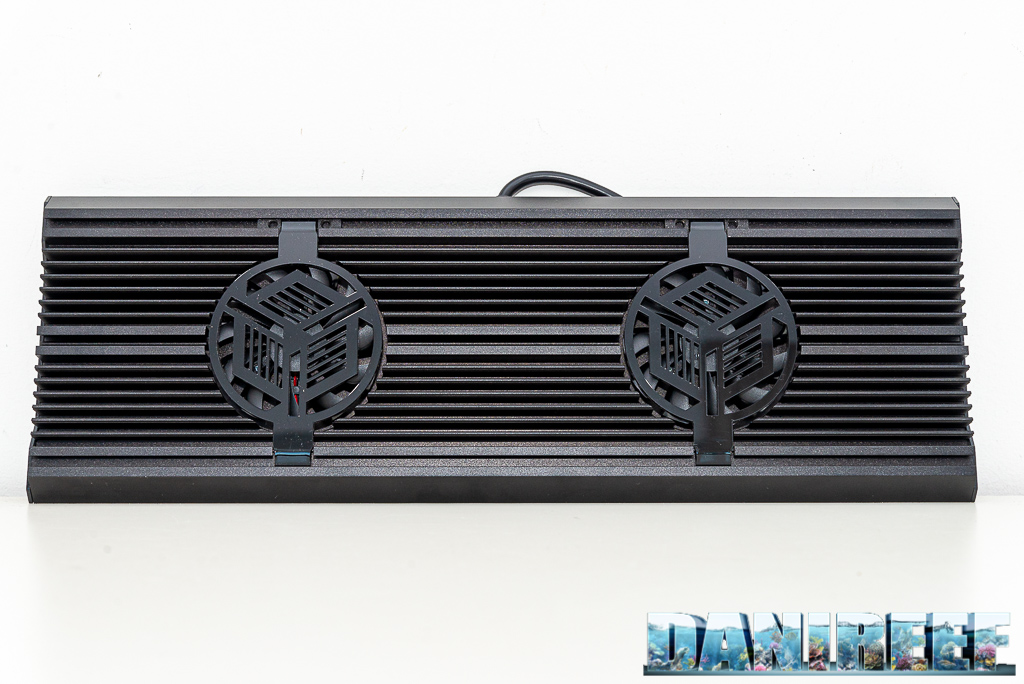
The Reef Flare PRO ceiling lights have a cooling system both active and passive, that uses two vents used through a sensor on the PCB. In addiction, the whole shell is in aluminium that dissipates heat better.
Let’s continue on page three with the costs, the comparison with the other ceiling lights and our final comment.


