Our new DaniReef LAB working method for measuring PARs
In the long nights spent on our forum (here) we have always wondered how we to compare the PAR values of different ceiling lights. Until now, although we have the appropriate instrument, the Quantum Meter MQ-500 from Apogee, we have always referred to the value measured at the center about 20 cm away from the ceiling light.
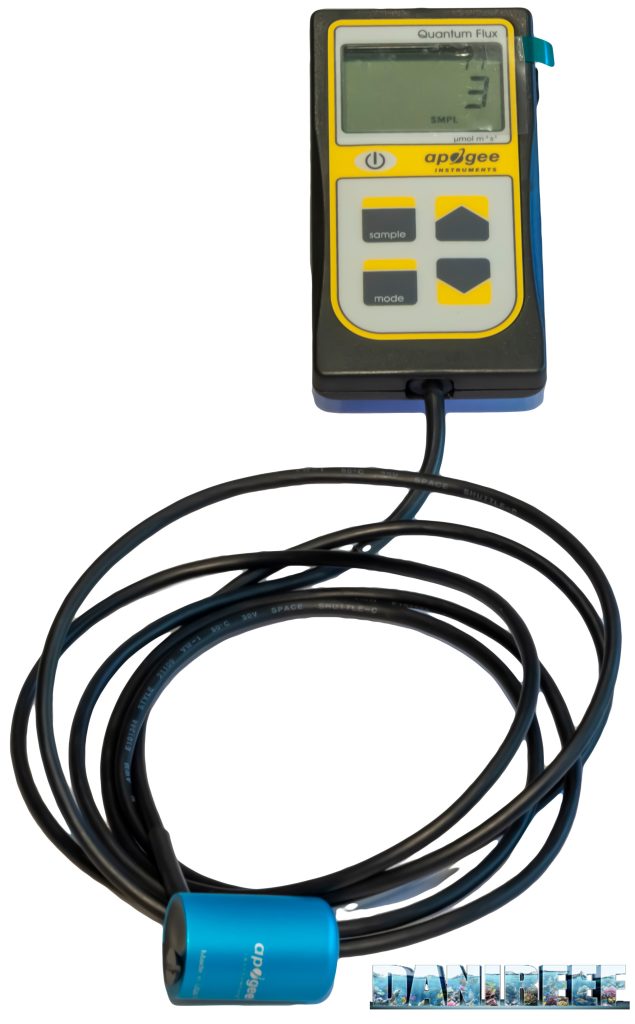
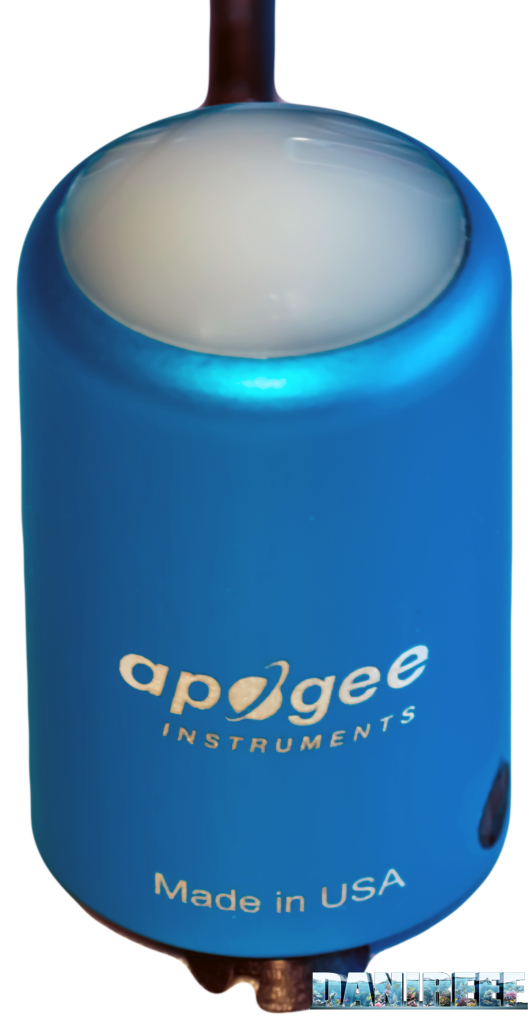
The Quantum Meter MQ-500 measures the PAR, expressed in PFFD or photosynthetic photon flux density in μmol m-2 s-1. This instrument is calibrated to work out of water, so used in water the measured value must be multiplied by 1.32 which is the immersion factor. Since there is no water, at the time of the tests we will see, we don’t need to do the conversion. The values that you will see will always be the correct ones.
So we decided to construct a 70×70 cm base, where we indicated 25 fiducial points to place the sensor of the Quantum Meter MQ-500. In order to place the ceiling plate, we created elevations of 20, 40 and 60 cm. So that the values will always be read at the same distance from the sensor. This will allow us to create curves in space that can be compared with those of other ceiling lights, again at the given distances. Note that this distance is measured between the base of the sensor and the base of the ceiling light. Actually, the distance needs to be decreased by 3.5 cm which is the height of the measuring cylinder and increased by 0.5 cm which is the size of the spacers that allow us to hold the ceiling light fixture up.
In total, the three measurements will then be taken at 17, 37 and 57 cm apart, in air, and the correction factor will be applied.
The measurement of PARs at a distance of 17 cm
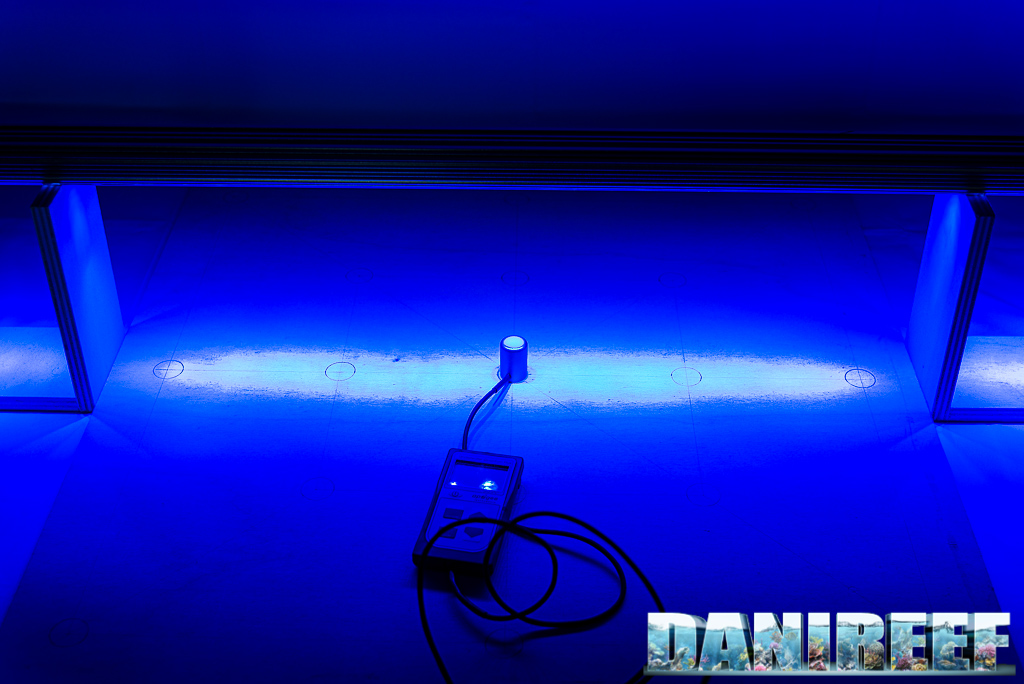
This is the test situation. Below you see the board, and the tool, and above you catch a glimpse of the bar (in this case a OR3 Blue Sky) resting on the spacers.
These are the measured values:
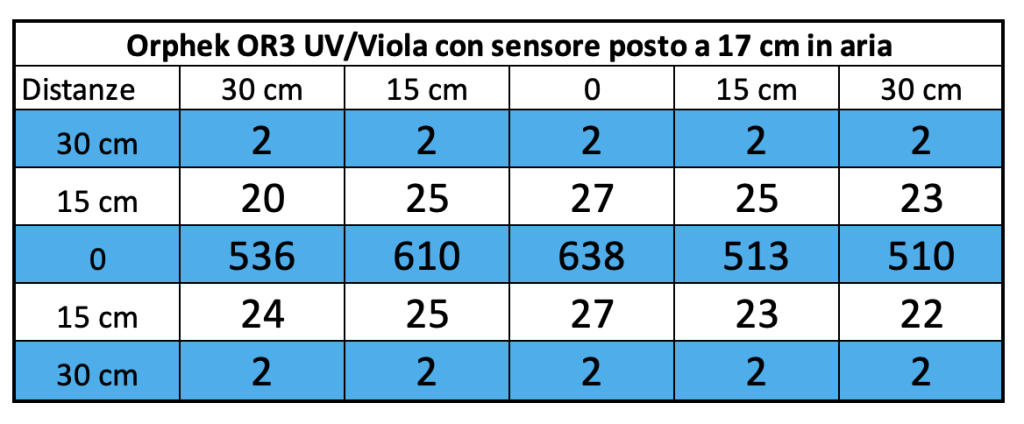
And this is the corresponding graph, for uniformity we will use the same scale for ceiling lights of homologous class, in this case talking about bars we have lowered the value of the maximum scale. In the next bars you will find the same rating scale.
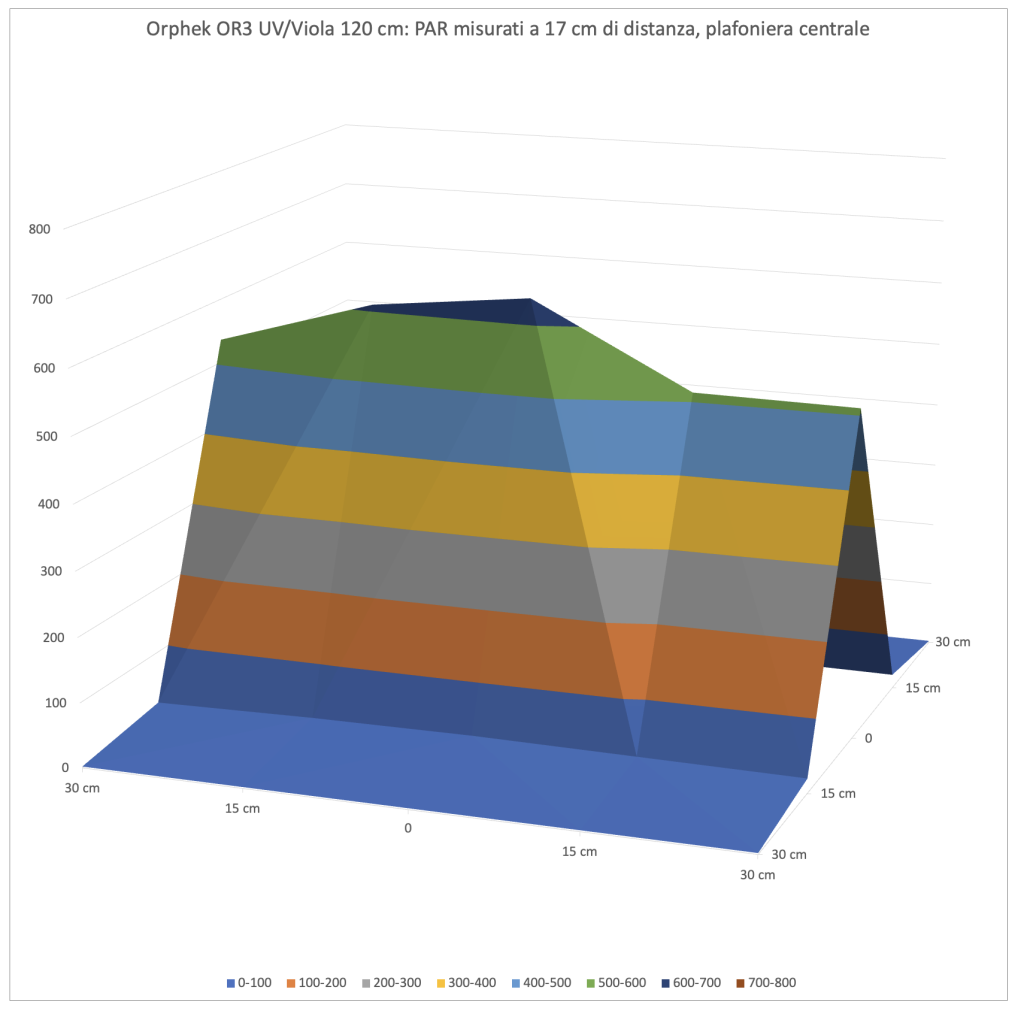
As can be seen, the bar creates a curve that resembles a curtain, with the spatial differences due to the type of LEDs used. Unlike classical ceiling lights therefore the decay is very linear, being about 20 cm from the light source. Curiously, on the right side of our specimen the PARs decrease somewhat compared to the center, probably depending on the type of coloration prominent on that side.
Let’s see the differences with the graphs of the LED bars tried to date. Remember that the scale is the same.
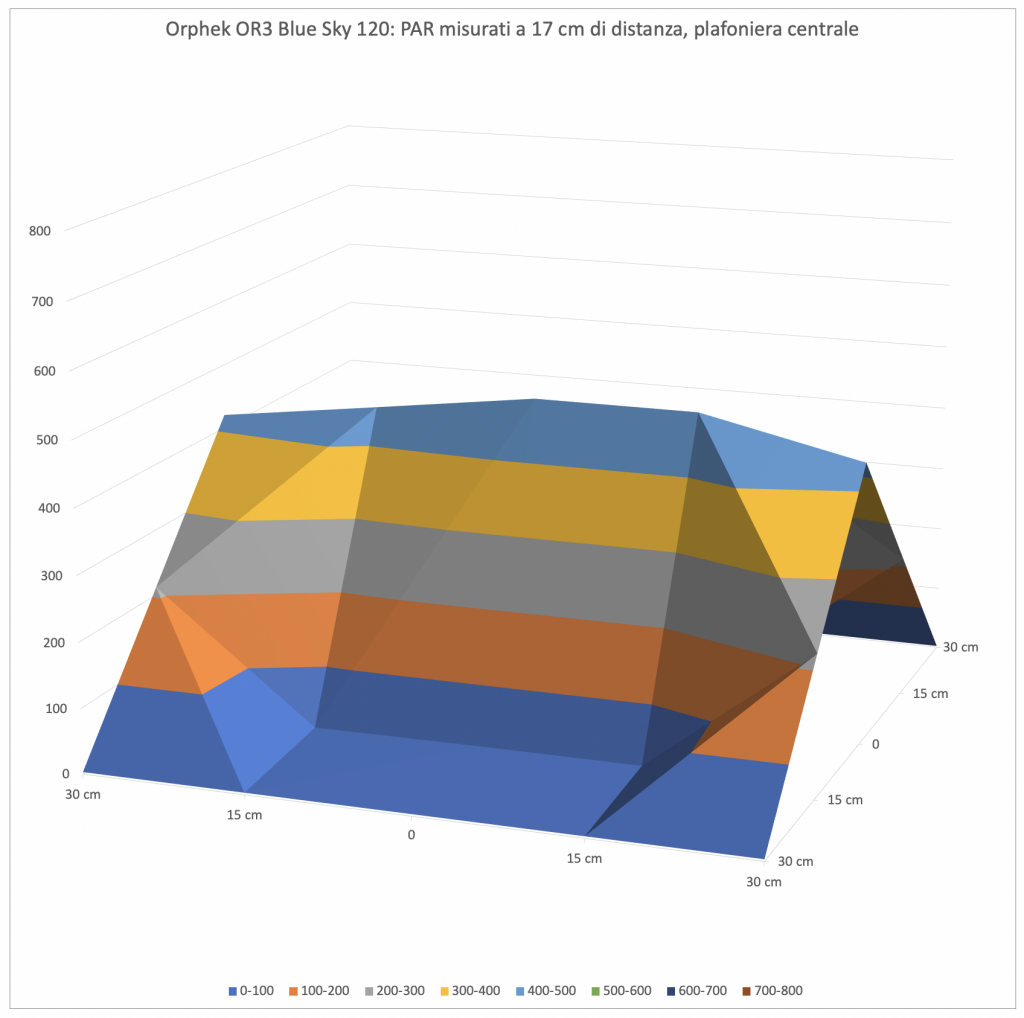
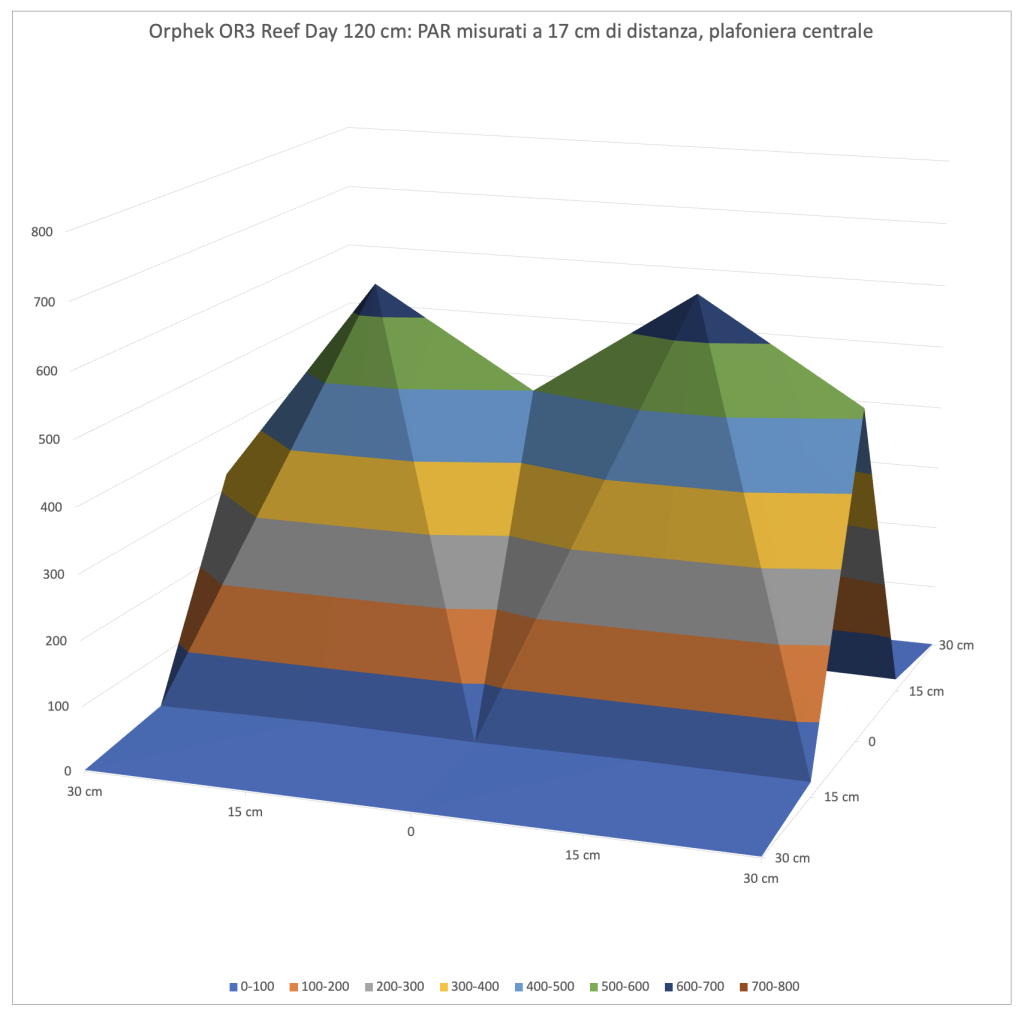
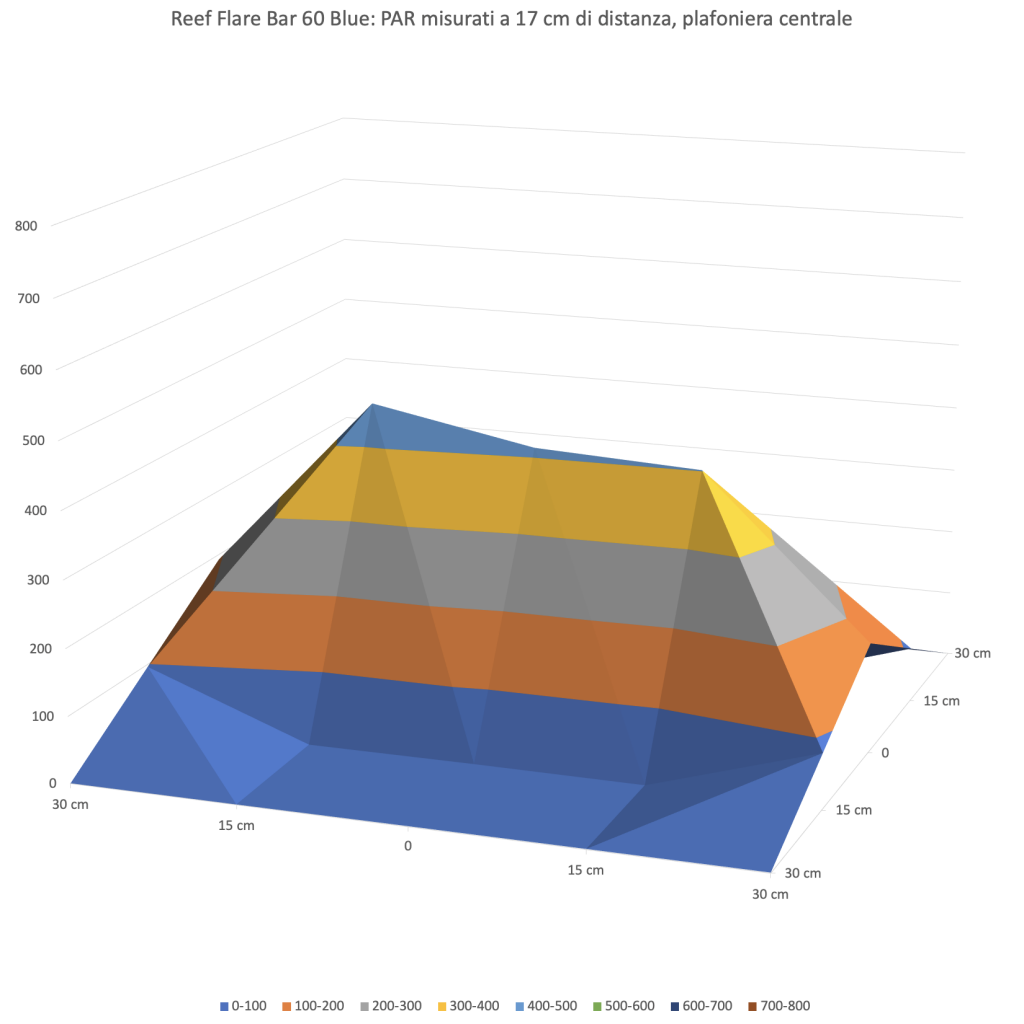
The behavior is similar to the other bars tested, with the OR3 UV/Violet having a peak PAR value only slightly lower than the Reef Day Plus but higher than the Blue Sky, and it is amazing when we think about what a huge difference in brightness we perceive with our eyes. Also noticeable is the difference with the Reef Flare S from Reef Factory, which however is just 60 cm long so the decrease in PAR at the edges is normal.
The measurement of PARs at a distance of 37 cm
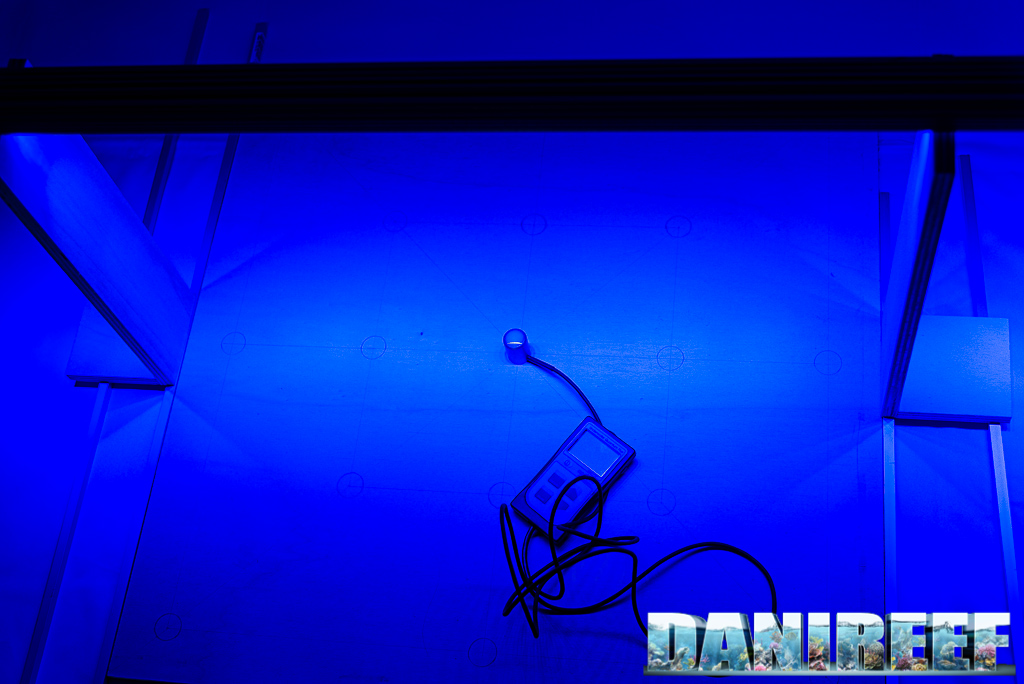
This is the test situation. Below you see the board, and the tool, and above you catch a glimpse of the bar (in this case a OR3 Blue Sky) resting on the spacers.
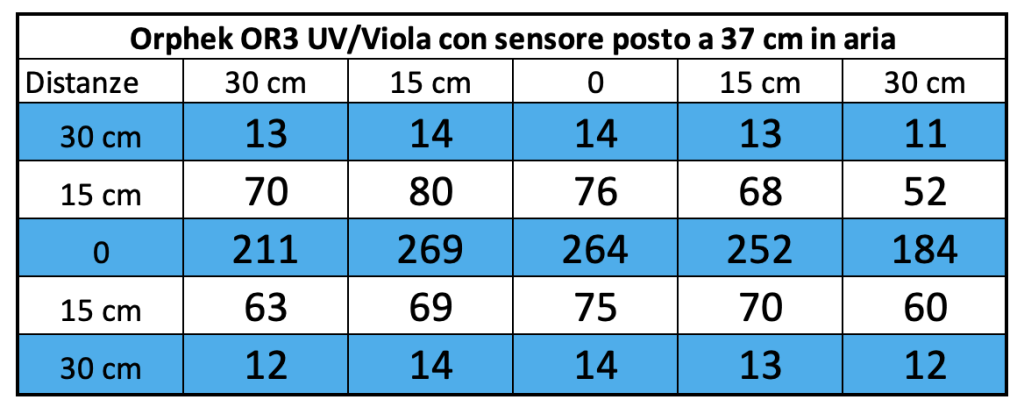
And this is the corresponding graph, for uniformity we will use the same scale for ceiling lights of homologous class, that is, similar in power and type.
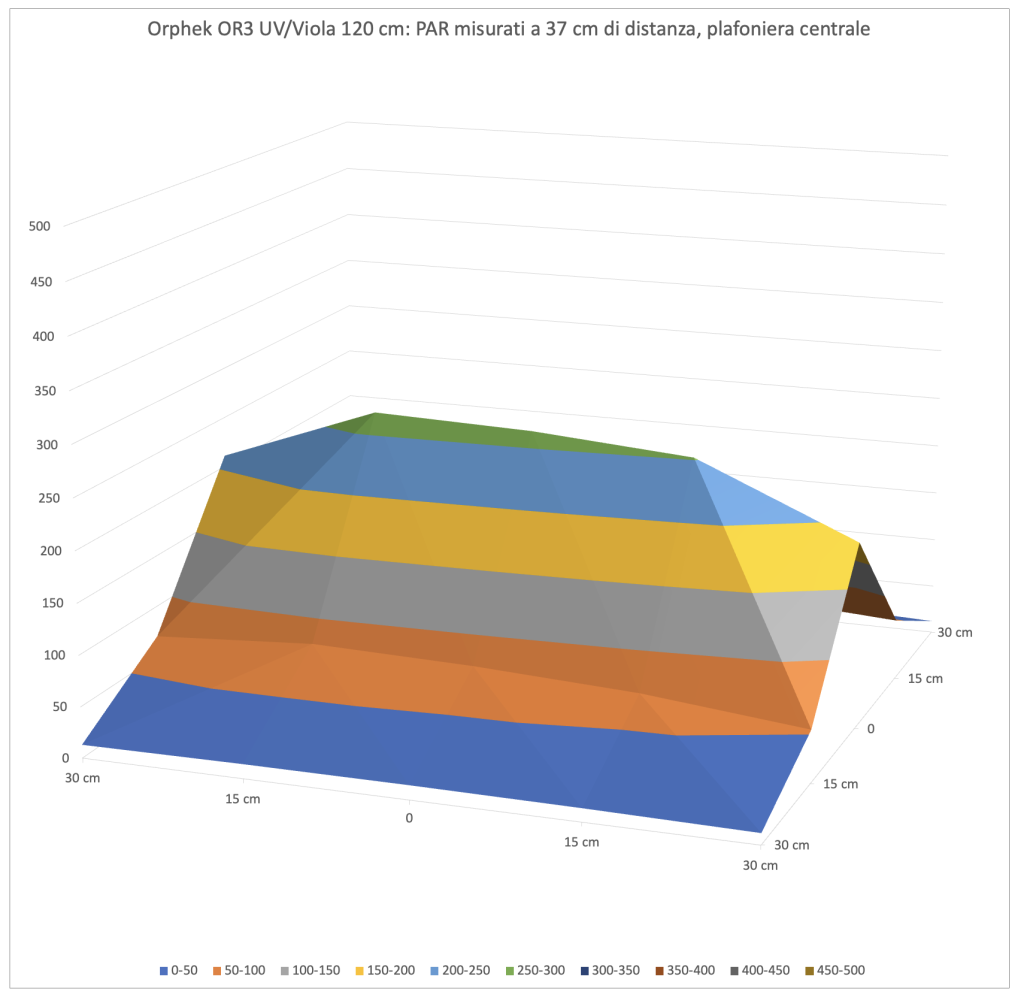
As the space between the ceiling light and the sensor increases, the difference between the PARs measured at the center and at the edges decreases. The light expands greatly, but the central value decreases from 638 to 264 μmol m-2 s-1, taken at the two brightest points.
It jumps out at you that the coverage is very full and much more linear. There remains this small offset to the center right.
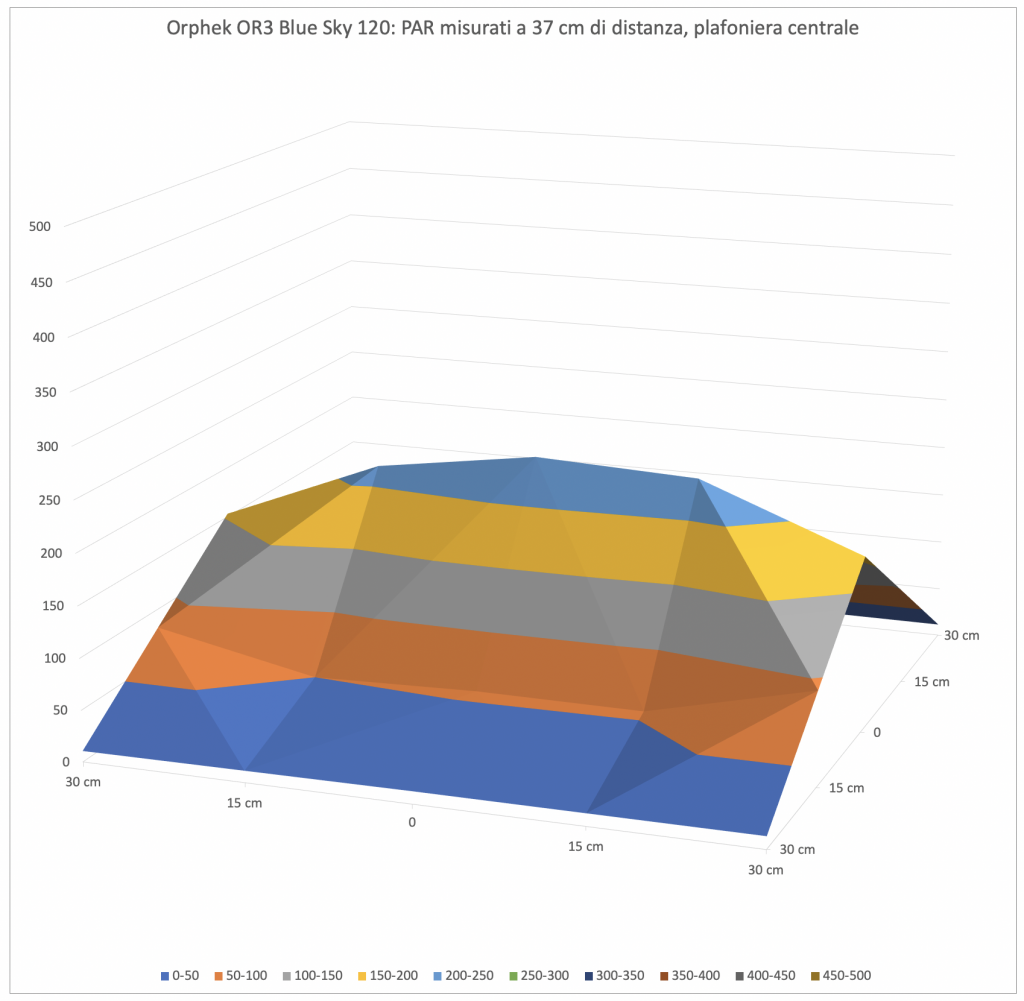
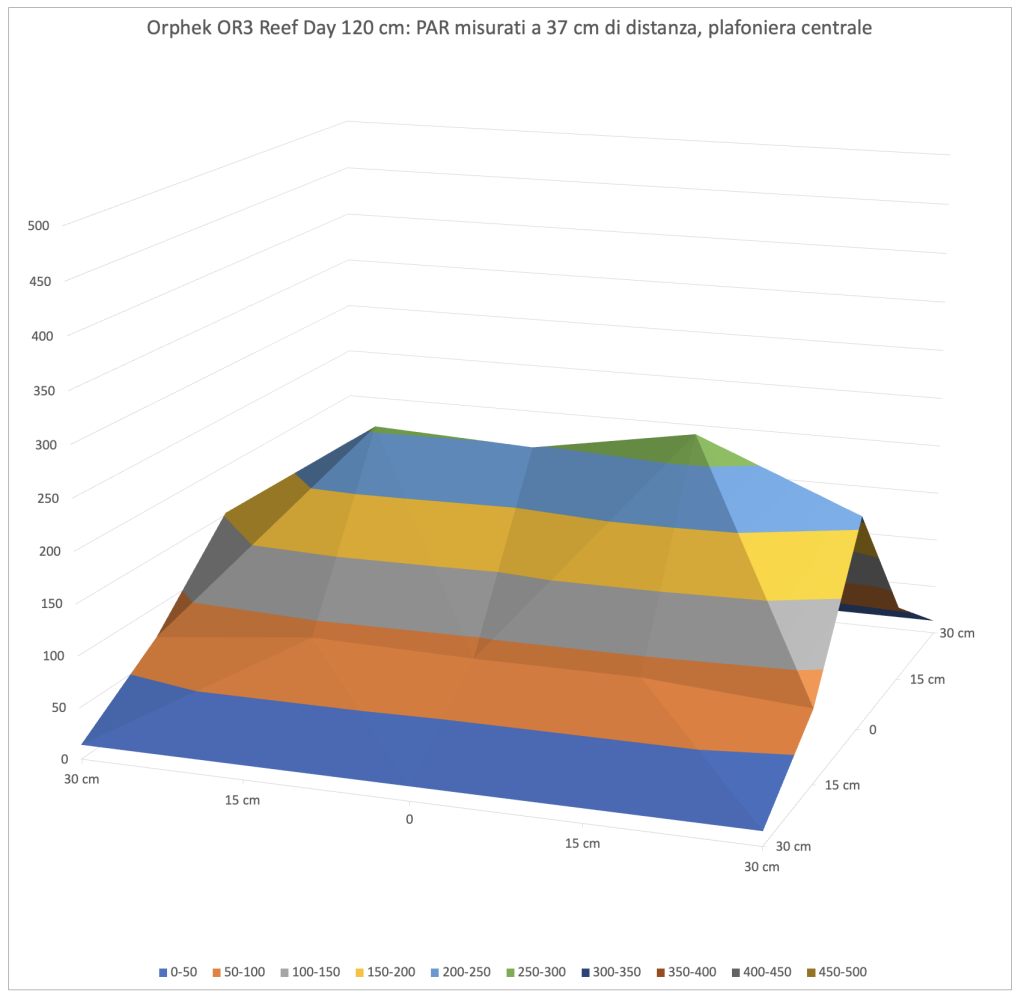
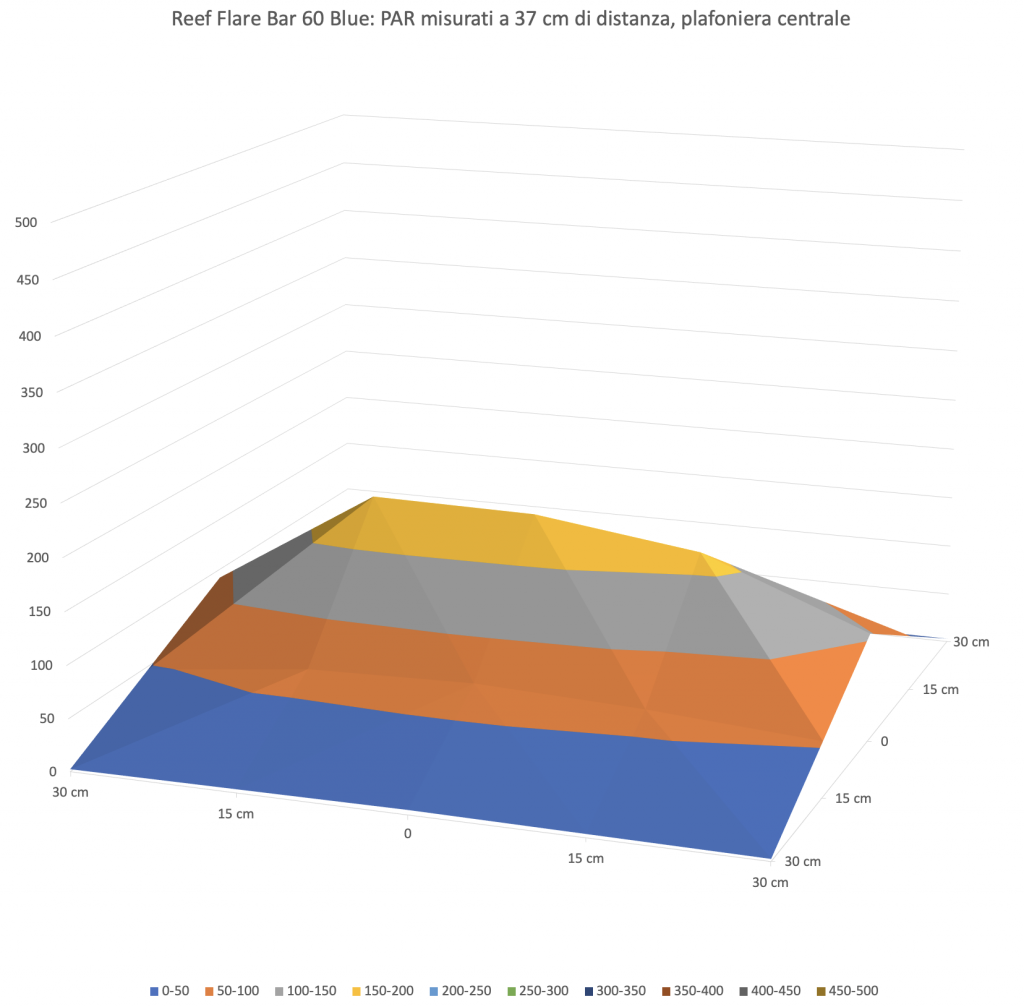
Again, the PAR value is almost at the levels of Reef Day, and higher than Sky Blue and ReefFactory’s Reef Flare Blue.
The measurement of PARs at a distance of 57 cm
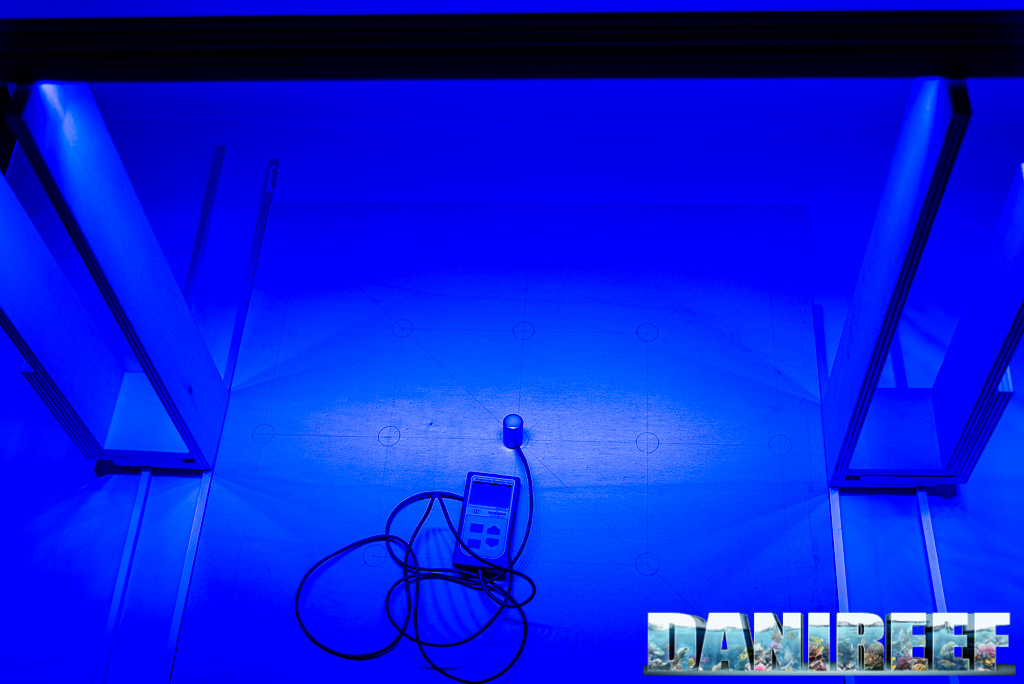
This is the test situation. Below you see the board, and from this distance you can see the instrument very well, and the ceiling light fixture resting on the spacers. Visually, the illuminated area is extremely large, and thus decreases the specific power per cm (in this case a OR3 Blue Sky).
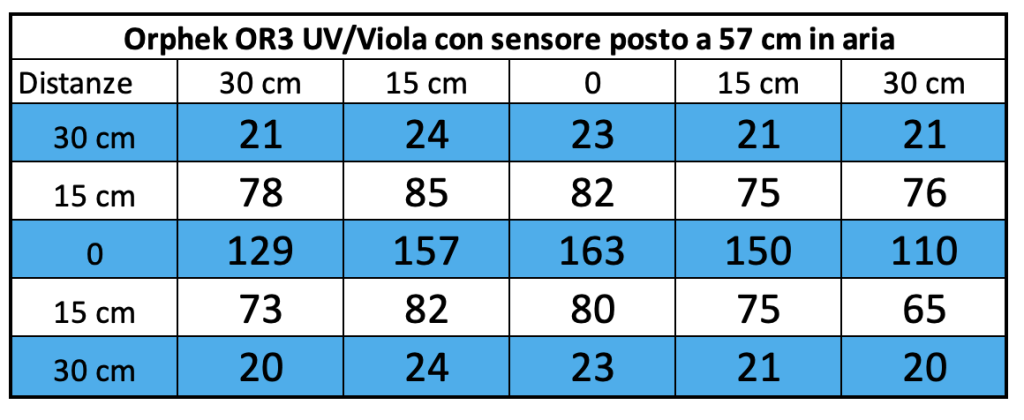
These are the measured values:
And this is the corresponding graph, for uniformity we will use the same scale for ceiling lights of homologous class, that is, similar in power and type.
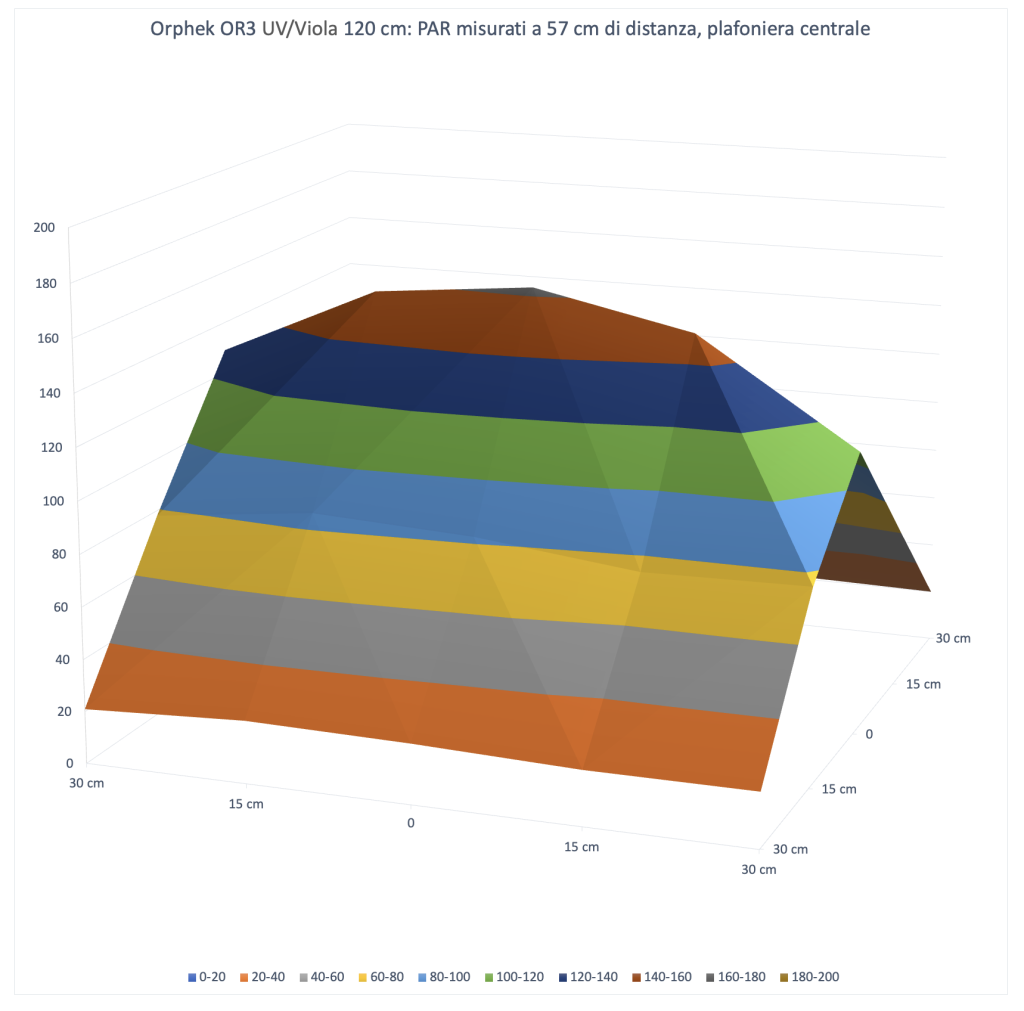
Increasing the space between the ceiling light fixture and sensor again, the spatial PAR distribution remains very uniform, with only a small longitudinal dip as was to be expected. The uniformity is practically perfect. The central value still decreases from 638 to 264 to 163 μmol m-2 s-1.
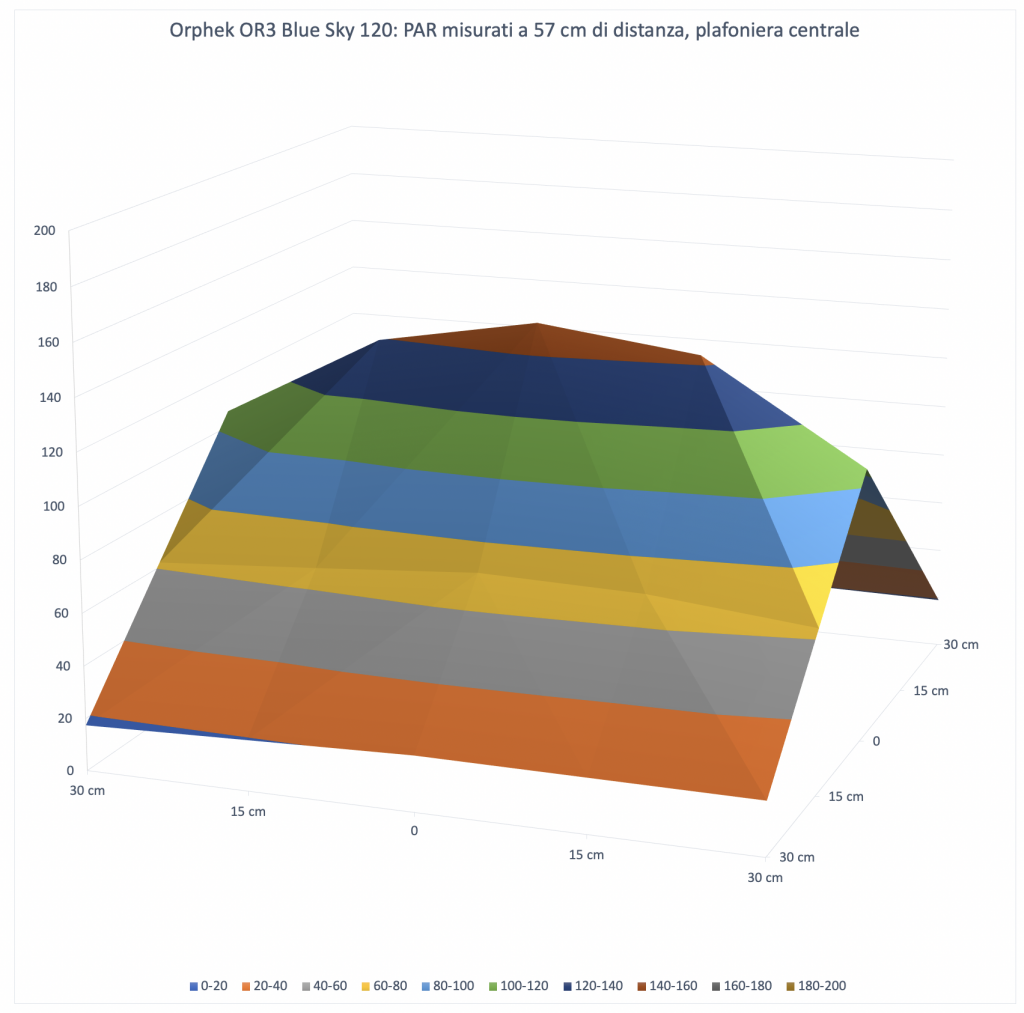
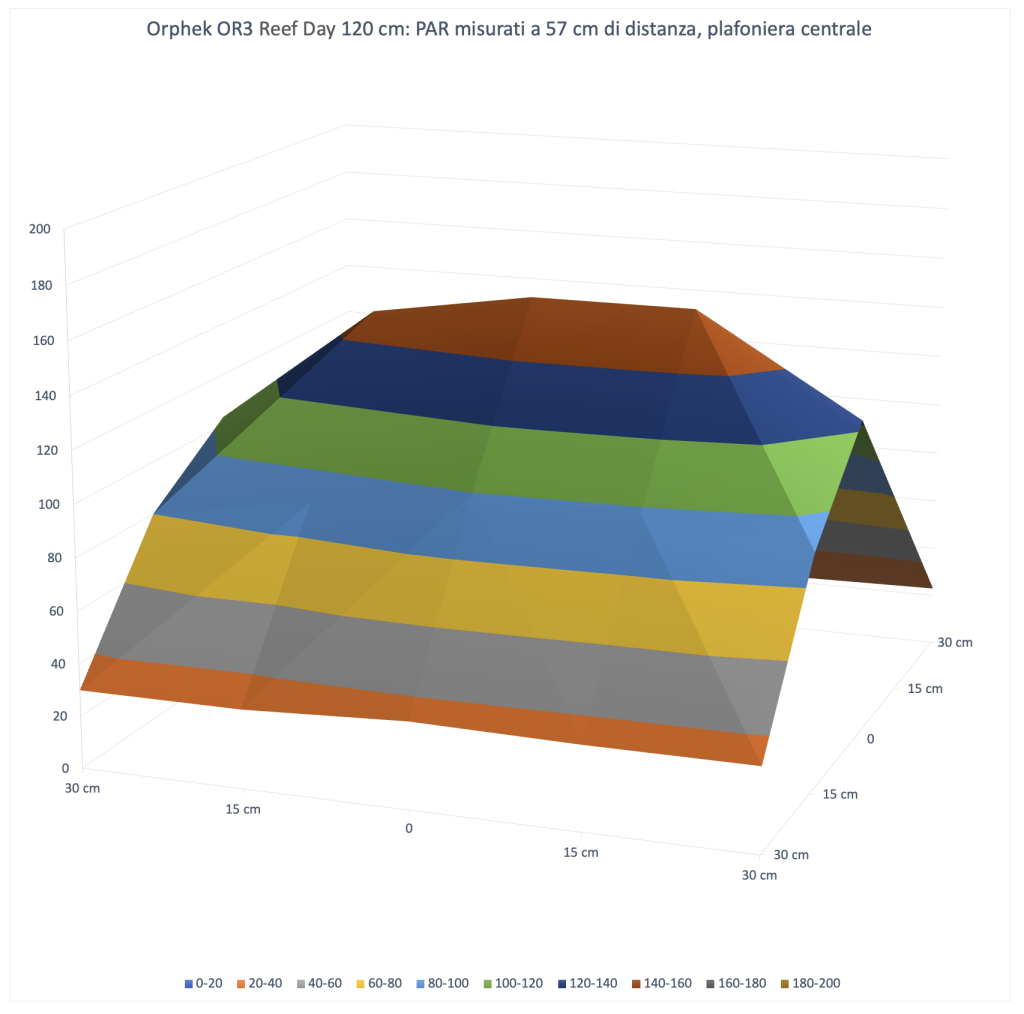
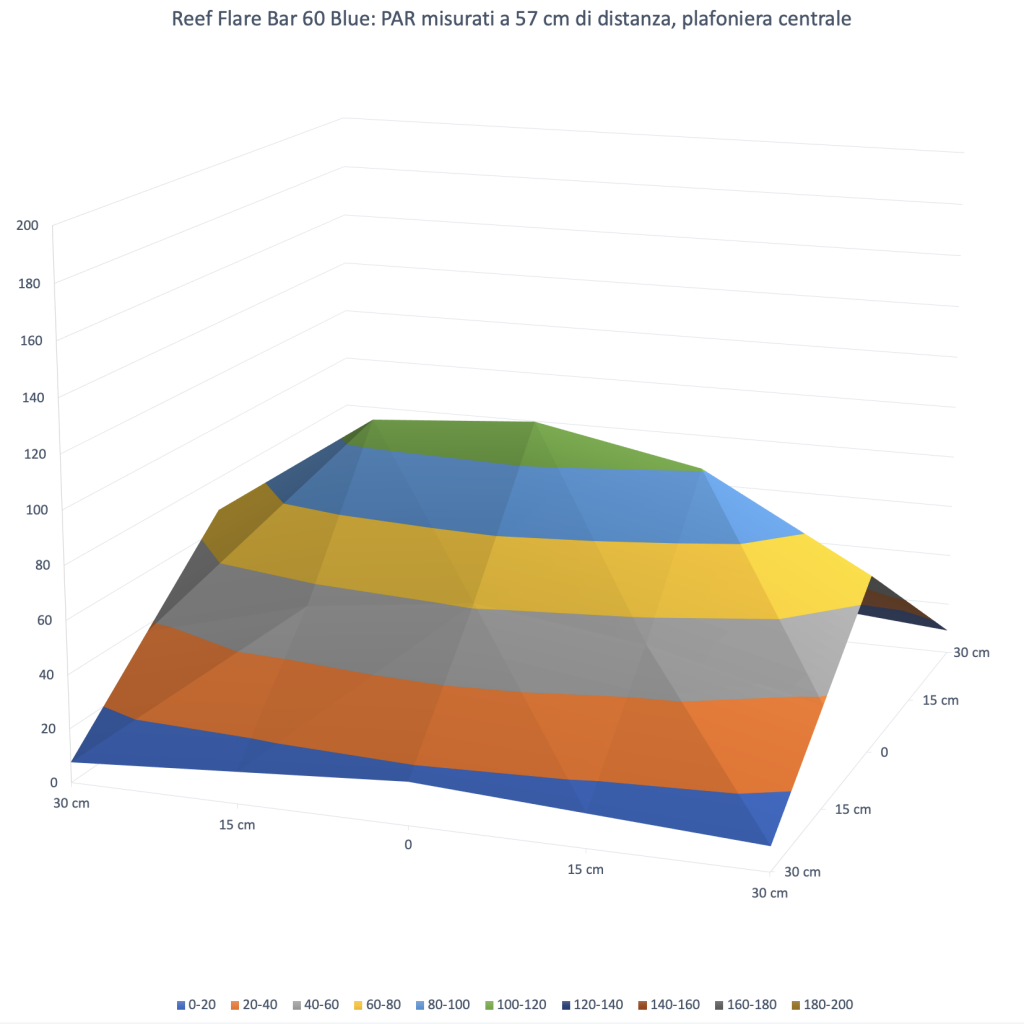
The comparison between the three bars increases again, much in the center where even the OR3 UV/Violet is the best performing of all, more than we would have expected, while at the edges the difference is minimal.
PARs in the center of different configurations
We continue with our technical measurements. Next we see how in a graph, the PAR measurements drop at the center in the three different distances of the test.
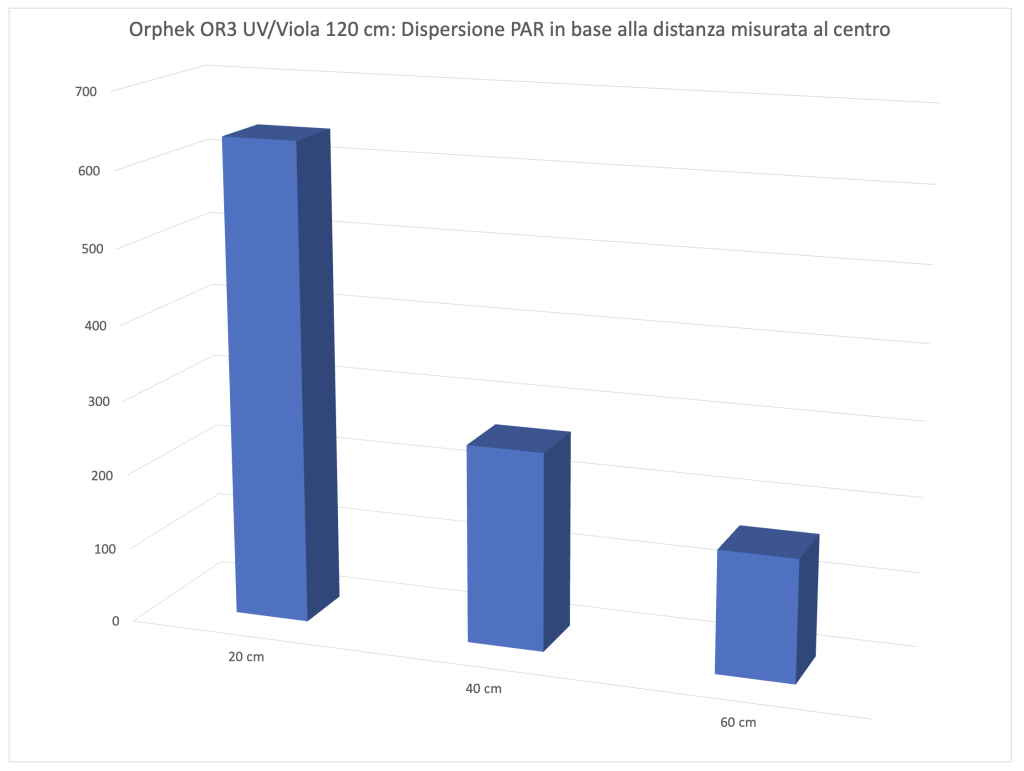
Energy Variation of Orphek OR3 UV/Violet LED Bars by Distance
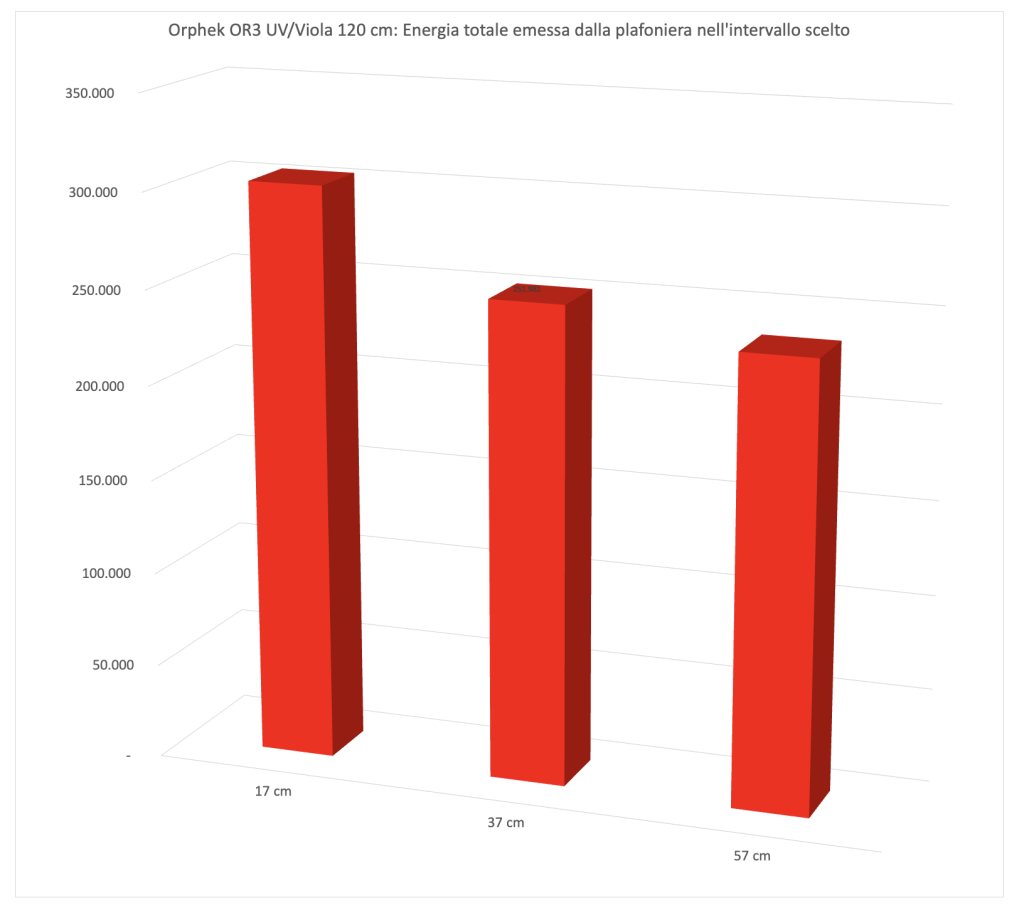
This in my opinion is the most significant data among those measured, and the most comparable. The energy variation. The volumes subtended by the three surfaces you saw previously were calculated. Because it is obvious that by moving away from the ceiling light the PAR values drop, but they also drop because the light illuminates a larger space. In this way you try to account for all the light energy contained in the hypothetical 60-cm square subtended by the ceiling light fixture. And you can see that the three values 303,000, 252,000 and 235,000 take on a different connotation than the values measured in the center. When the former decrease a lot because the distances increase, the subtended area, that is the energy, decreases very slowly. The differences between the three areas is very small indeed. Little energy is sent out of the subtended area.
In fact, looking at the values of the three curves, at the edges there is much more light at 57 cm than at 37. Also remarkable is the fact that the energy at 37 and 57 cm is virtually the same.
We continue at page three with usage costs, comparisons with other ceiling lights, and our final commentary.


