


Our New DaniReef LAB Methodology for PAR Measurement
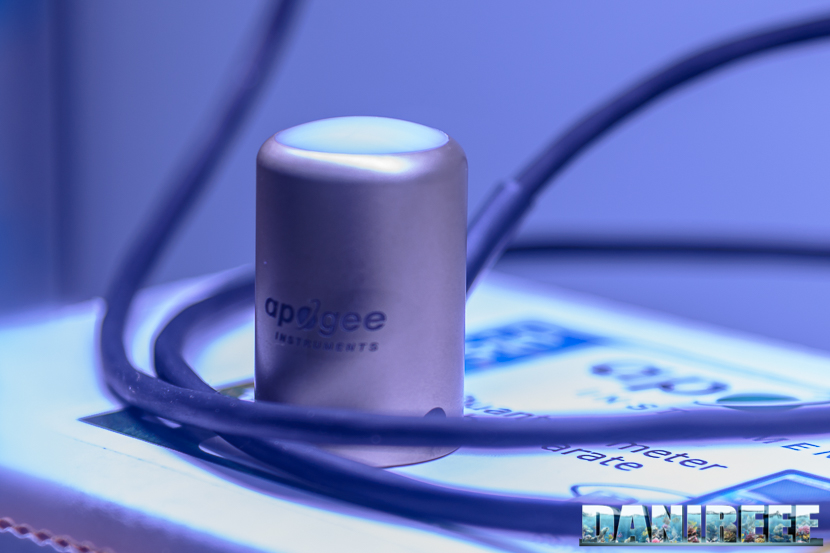
During the long nights spent on our forum, we’ve often wondered how to approach comparing PAR values from different light fixtures. Until now, we’ve done this using the Apogee Quantum Meter MQ-510.

The Quantum Meter MQ-510 measures PAR, expressed as PFFD (Photosynthetic Photon Flux Density) in μmol m⁻² s⁻¹. This instrument is calibrated to work underwater, so when used in air, the measured value must be divided by 1.32, which is the immersion factor. Since there’s no water during the tests we’ll see, we need to perform this conversion. The values you’ll see will always be the correct ones.

We decided to build a 70×70 cm base, where we marked 17 reference points to position the sensor of the Quantum Meter MQ-510. To position the light fixture, we created risers at 20, 40, and 60 cm. This allows us to take readings at consistent distances from the sensor. This will enable us to create spatial curves that can be compared with those of other fixtures, always at the given distances. Note that this distance is measured between the base of the sensor and the base of the light fixture. In reality, the distance must be reduced by 3.5 cm (the height of the measurement cylinder) and increased by 0.5 cm (the size of the spacers that keep the fixture elevated).
In total, the three measurements will be taken at 17, 37, and 57 cm in air, and the correction factor will be applied.
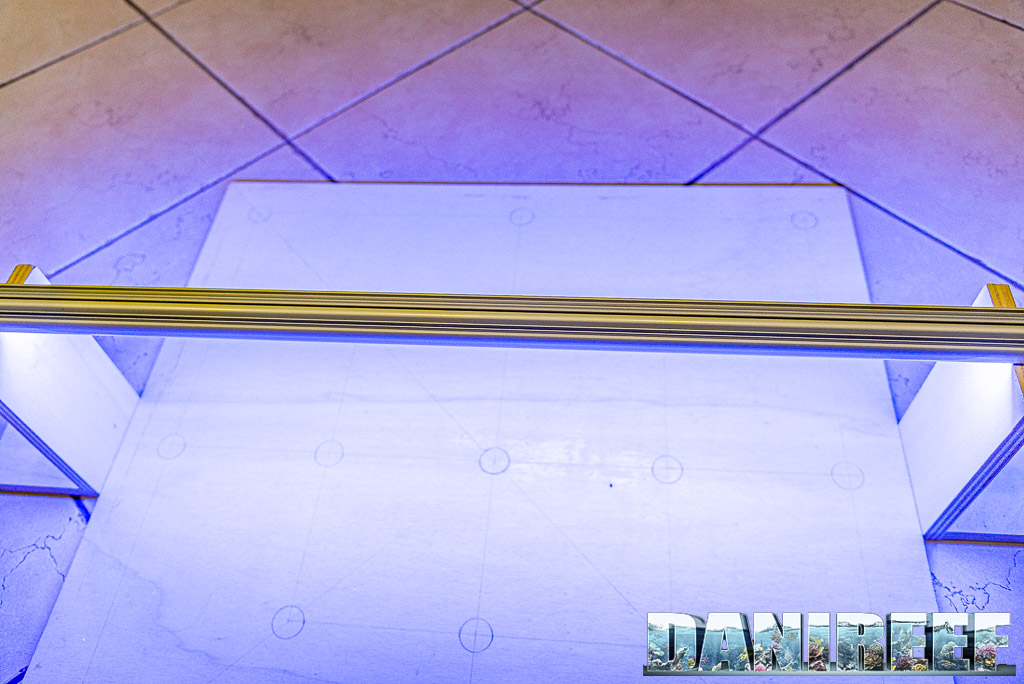
Above, you can see our measurement board with spacers to keep the LED bar elevated 17 cm above the board and the fixture itself. This ensures consistent values for any fixture we test and facilitates comparisons.
To this system, we’ve also added the new ITC PARwise, which allows us to measure PAR, generate spectral analysis, and, most importantly, evaluate cPUR. cPUR (Coral Photosynthetically Usable Radiation) is a measurement of light specifically designed for corals. PAR doesn’t tell us whether the light we’re measuring is actually useful for coral growth. You can have a high PAR level but concentrated entirely in the wrong part of the spectrum. As a measurement parameter, it’s now quite outdated.
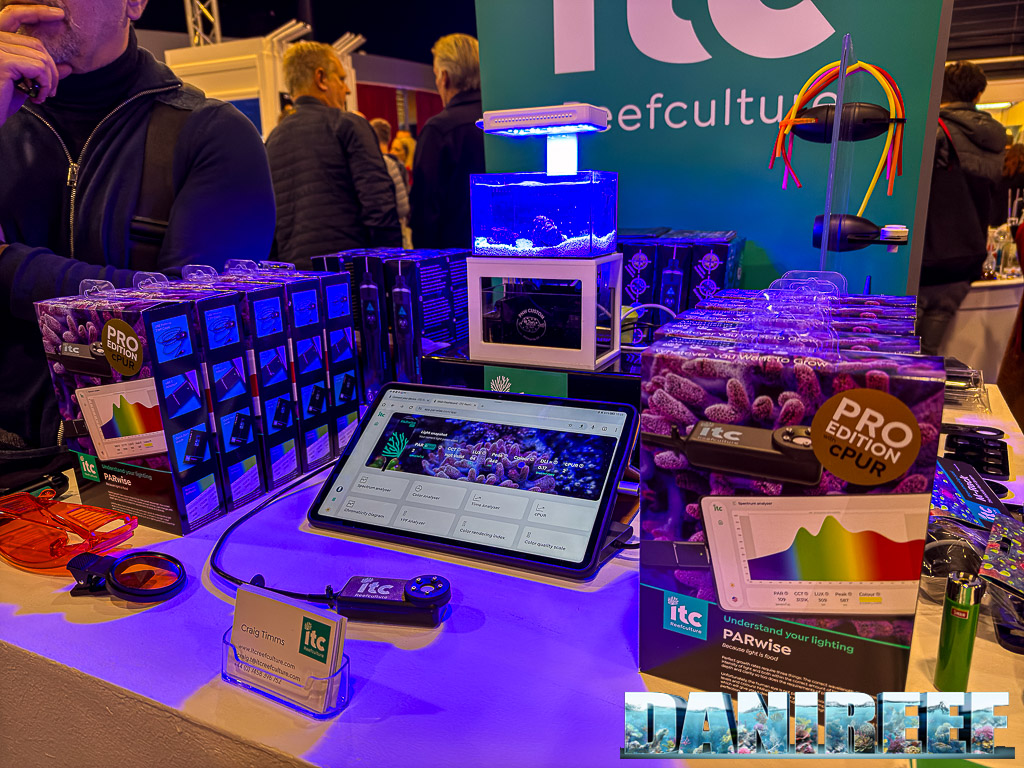
cPUR includes only the wavelengths and intensity of light that corals can actually use, excluding those that aren’t efficiently utilized in photosynthetic processes or fluorescent proteins.
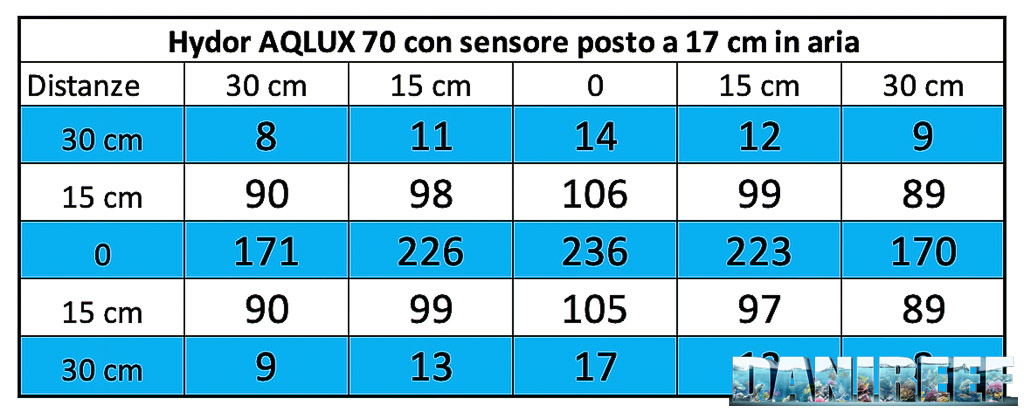
PAR Measurement at 17 cm Distance
Here are the recorded values:
And here is the corresponding graph. For consistency, we’ll use the same scale for comparable fixtures. In this case, since we’re dealing with bars, we’ve lowered the maximum scale value. In future bar tests, you’ll find the same evaluation scale.
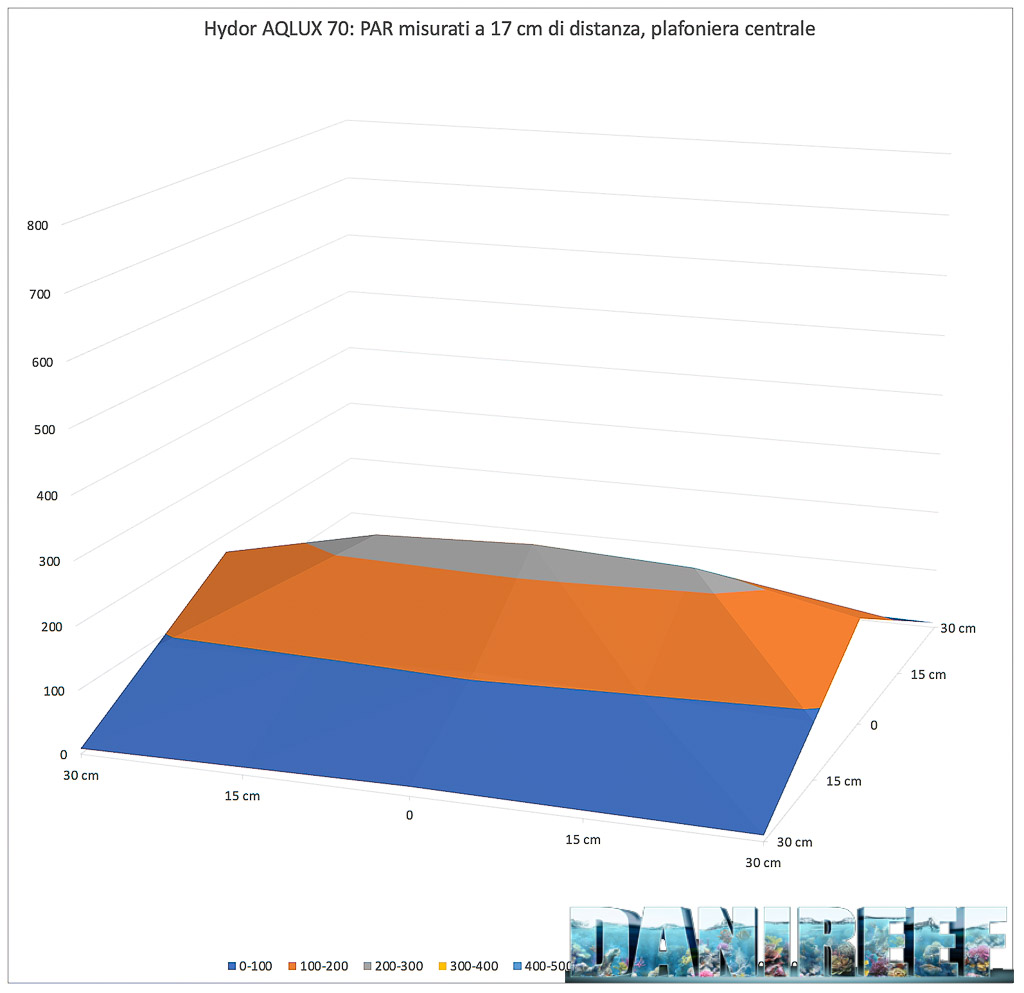
As you can see, the bar creates a curve resembling a tent, with perfect uniformity in the central value and minimal lateral values. Unlike traditional fixtures, the decay is very linear, as we’re about 20 cm from the light source. We notice a slight decrease in brightness at the central edges, which is normal because the reinforcement of the central light is missing.
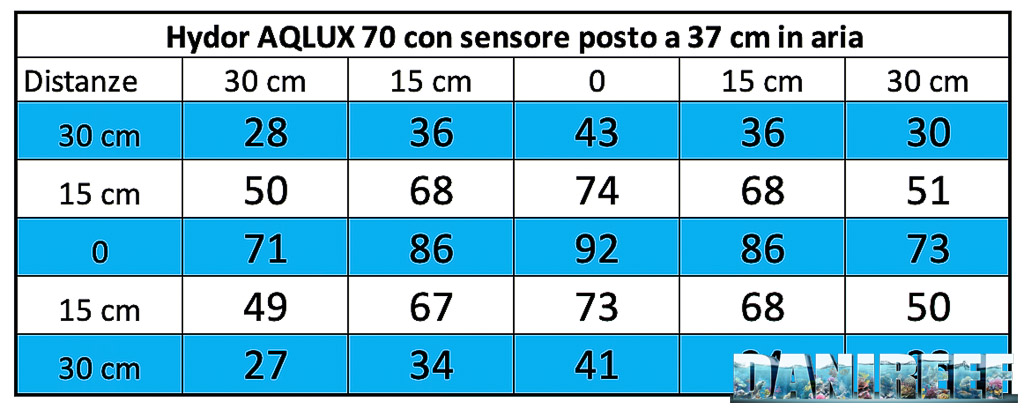
PAR Measurement at 37 cm Distance
Here are the recorded values:
And here is the corresponding graph. For consistency, we’ll use the same scale for comparable fixtures, i.e., those with similar power and type.
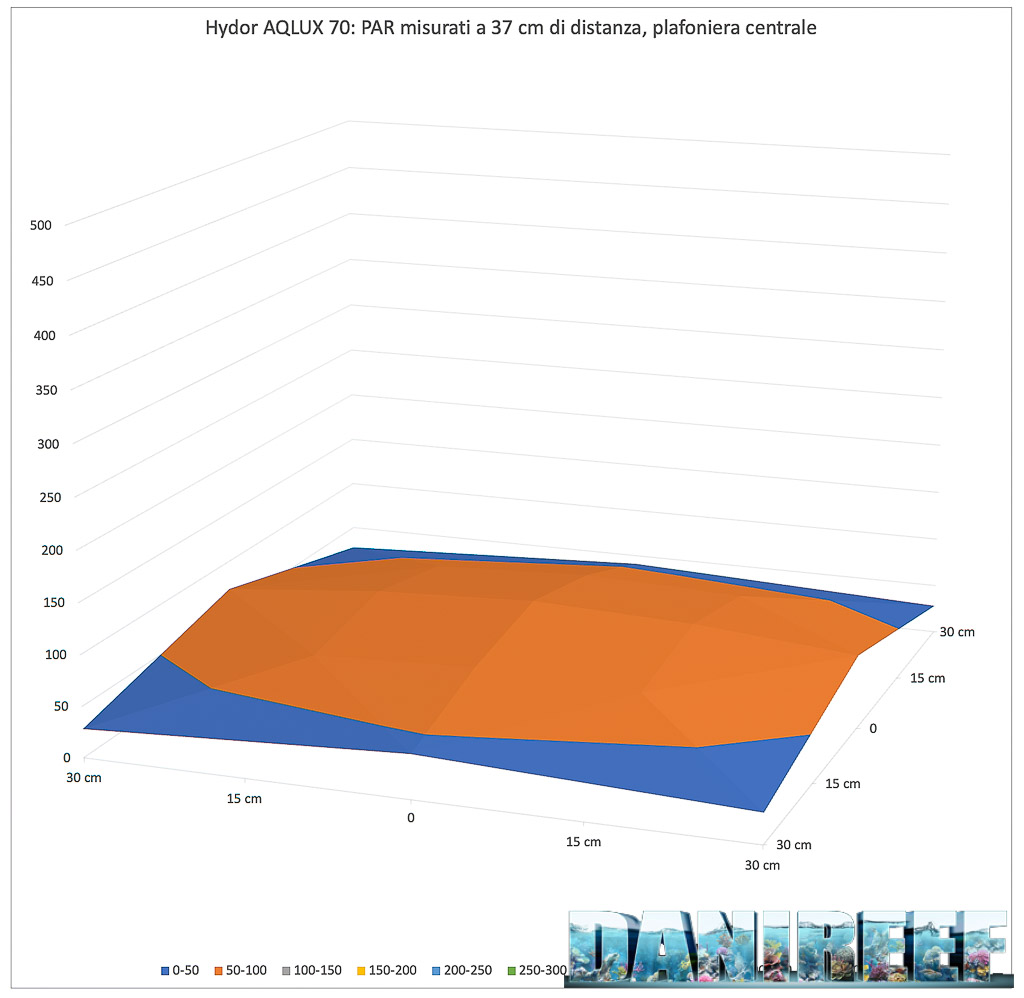
As the distance between the fixture and the sensor increases, the difference between the PAR values measured at the center and the edges decreases. The light spreads significantly, and the central value drops from 236 to 92 μmol m⁻² s⁻¹, taken at the two brightest points.
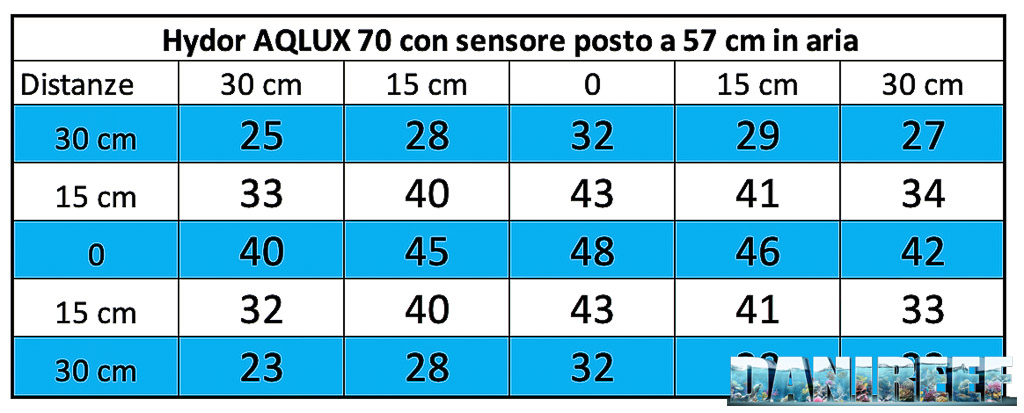
PAR Measurement at 57 cm Distance
Here are the recorded values:
And here is the corresponding graph. For consistency, we’ll use the same scale for comparable fixtures, i.e., those with similar power and type.
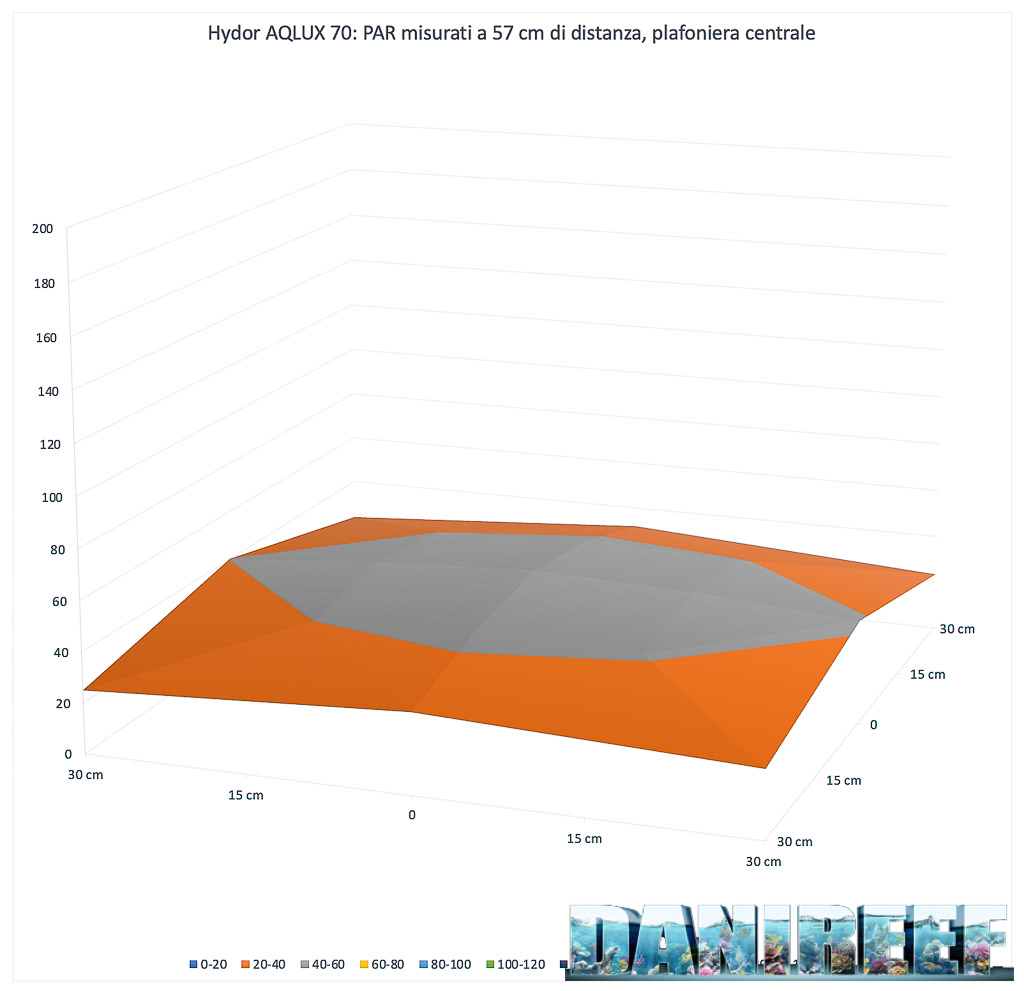
As the distance between the fixture and the sensor increases further, the uniformity of the measured values improves. The uniformity is practically perfect. The central value drops again from 236 to 92 to 48 μmol m⁻² s⁻¹.
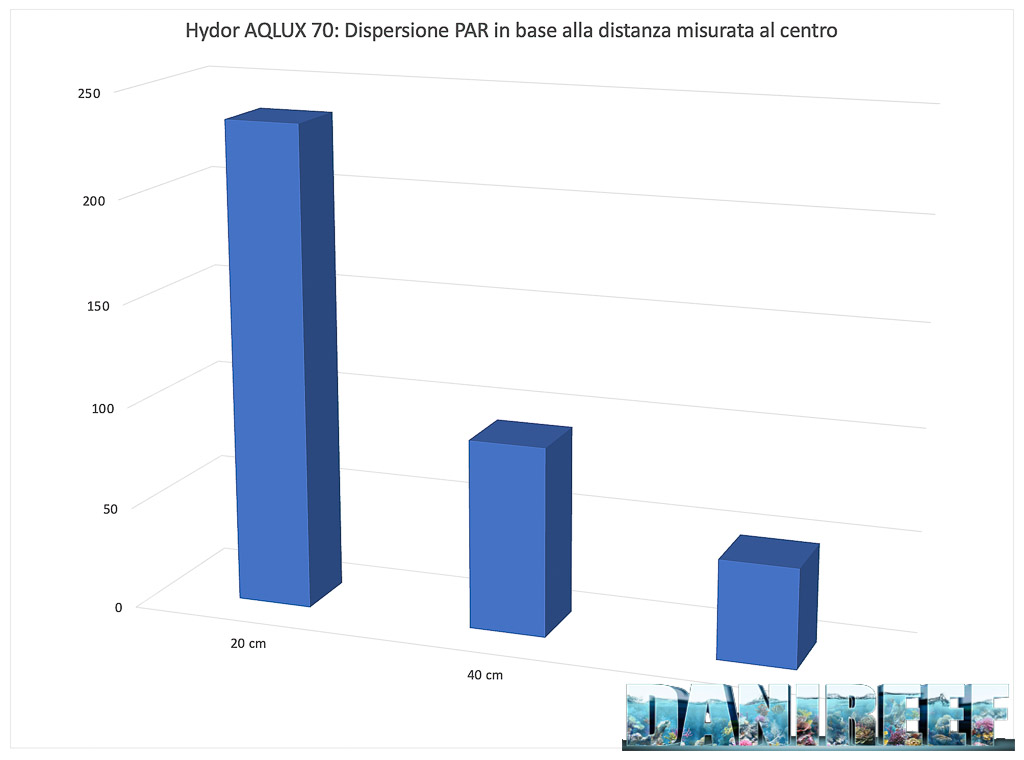
Central PAR Values in Different Configurations
We continue with our technical measurements. Below, we see how the central PAR measurements drop in a graph across the three different distances tested, indicating the lenses used in the fixture.
Energy Variation of the Hydor AQLUX 700 Reef LED Bars Based on Distance
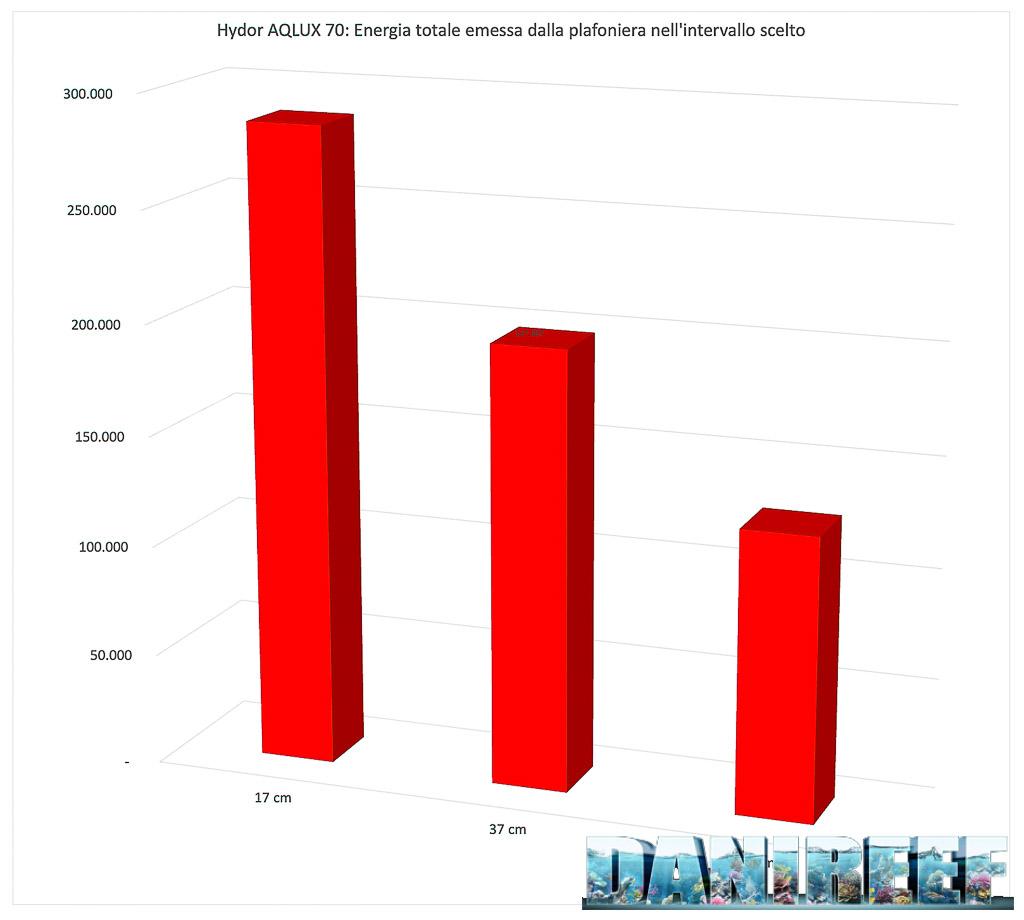
In my opinion, this is the most significant data point among those measured and the most comparable: the energy variation. The volumes subtended by the three surfaces you saw earlier were calculated. It’s obvious that as you move away from the fixture, the PAR values drop, but they also drop because the light illuminates a larger area. This method accounts for all the light energy contained in the hypothetical 60 cm square subtended by the fixture. We see that the three values—287,000, 198,000, and 127,000—take on a different connotation compared to the central measured values. While the former drop significantly as distances increase, the subtended area, i.e., the energy, decreases more slowly.
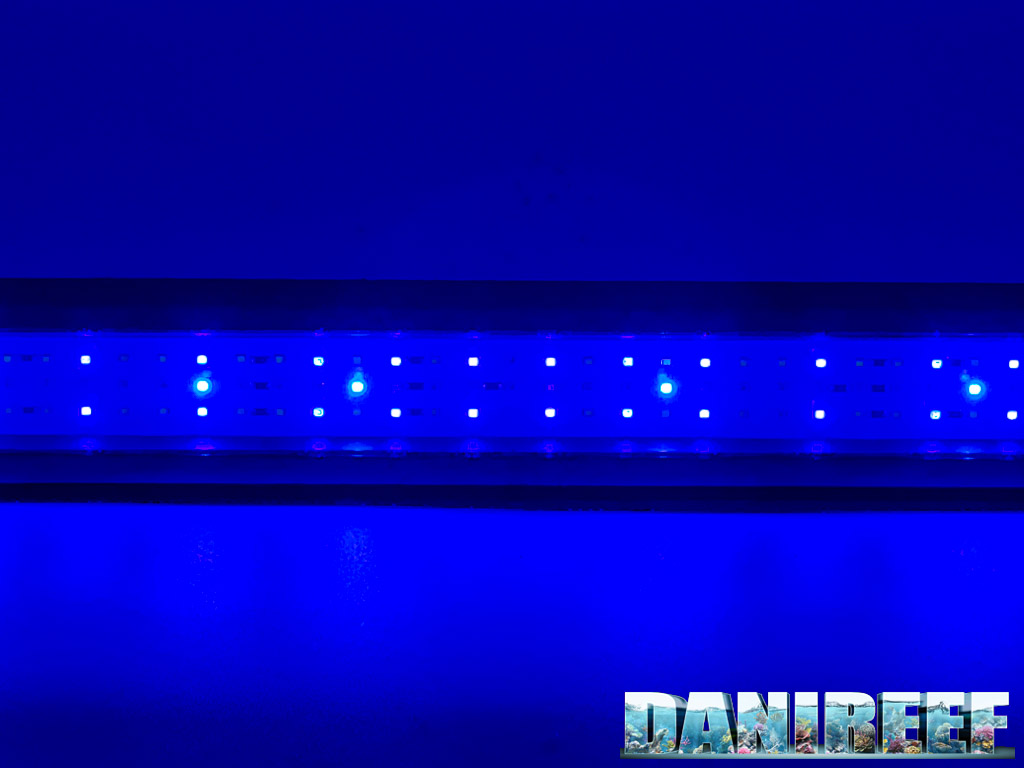
LEDs of the Hydor AQLUX 700 Reef Fixture
Thanks to the use of the ITC PARwise, we’ve also measured other values, including the light spectrum and the important cPUR.
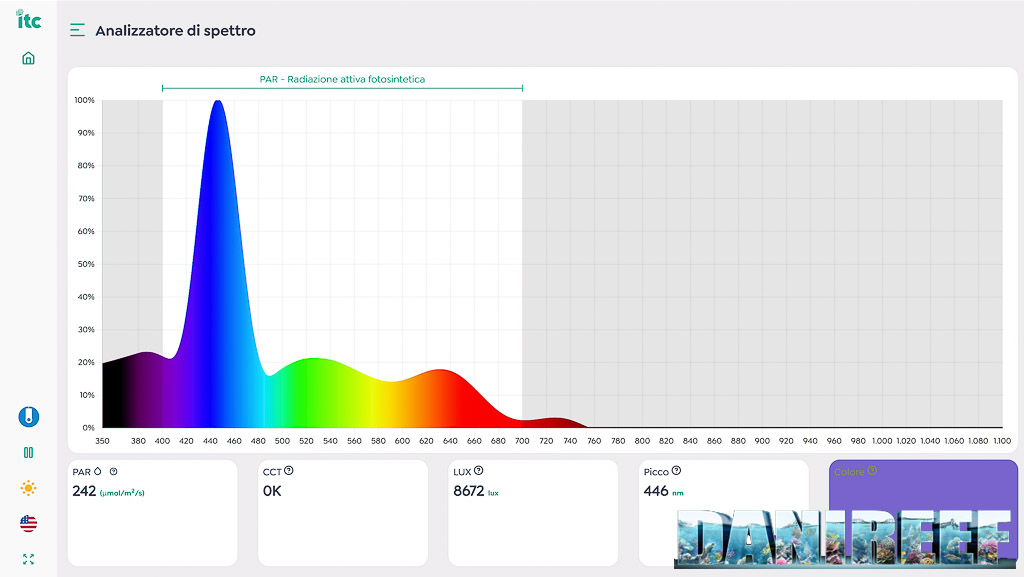
Above, we see the light spectrum as recorded by the PARwise. Of course, the spectrum is created using discrete point measurements, so the curve isn’t as perfect as one recorded by a more precise instrument. However, it provides a sufficiently accurate idea, showing a predominance around 446 nm, where it achieves maximum PAR. Overall, it also indicates a maximum lux of 8,672 and 242 PAR. Obviously, we’re talking about a distance of about 17 cm with the sensor placed at the center.
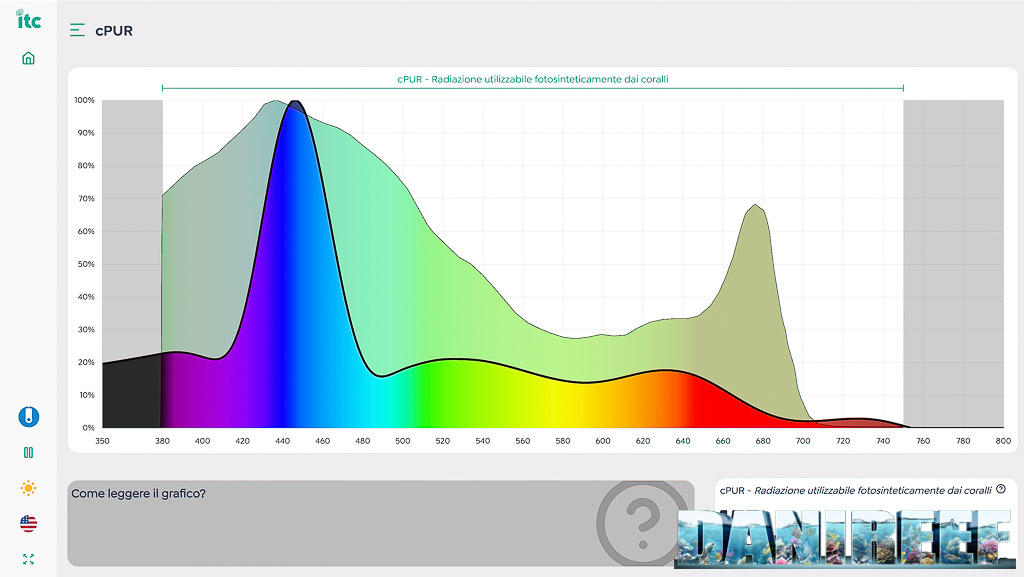
Above, we see the green curve indicating cPUR, i.e., the maximum photosynthetically usable radiation for corals. We see that the spectrum of the Hydor AQLUX 700 Reef is entirely below that curve. In practice, there’s no dispersion of light unused by corals, and that’s what matters.
We continue on page three with usage costs, comparisons with other fixtures, and our final comments.


